Global Meta Insights – July 2022 Edition
Is the possibility of an economic downturn likely to knock confidence in travel?
We continue to monitor travel and metasearch demand trends, total hotel searches, bookings and conversion rates across all metasearch channels globally to bring you valuable insights to assist hotels in identifying future opportunities for your business.
Our July data shows strong metasearch performance indicators for much of the world during the four weeks ending 31 July 2022. Among the headlines, Asia Pacific continues to open its markets and travel, posting strong recovery. Although intra-regional travel dominates, international travel trends are showing growing signs. Chinese markets on the ptherhand still showing variance in recovery pace due to Covid restrictions. .
In Europe, summer travel demand continues albeit the conflict in Ukraine rages on. Labour shortage has had more of an impact to smooth travel but metasearch has seen no signs in slowing down. Travel intent, conversion and return advertising spend continues to perform well.
On the other hand, US travellers’ remain domestic focus and continues to flock to markets such as Las Vegas and Los Angeles has entered one of the top cities travelled to for the first time since the pandemic.
Source: Google Destination Insights
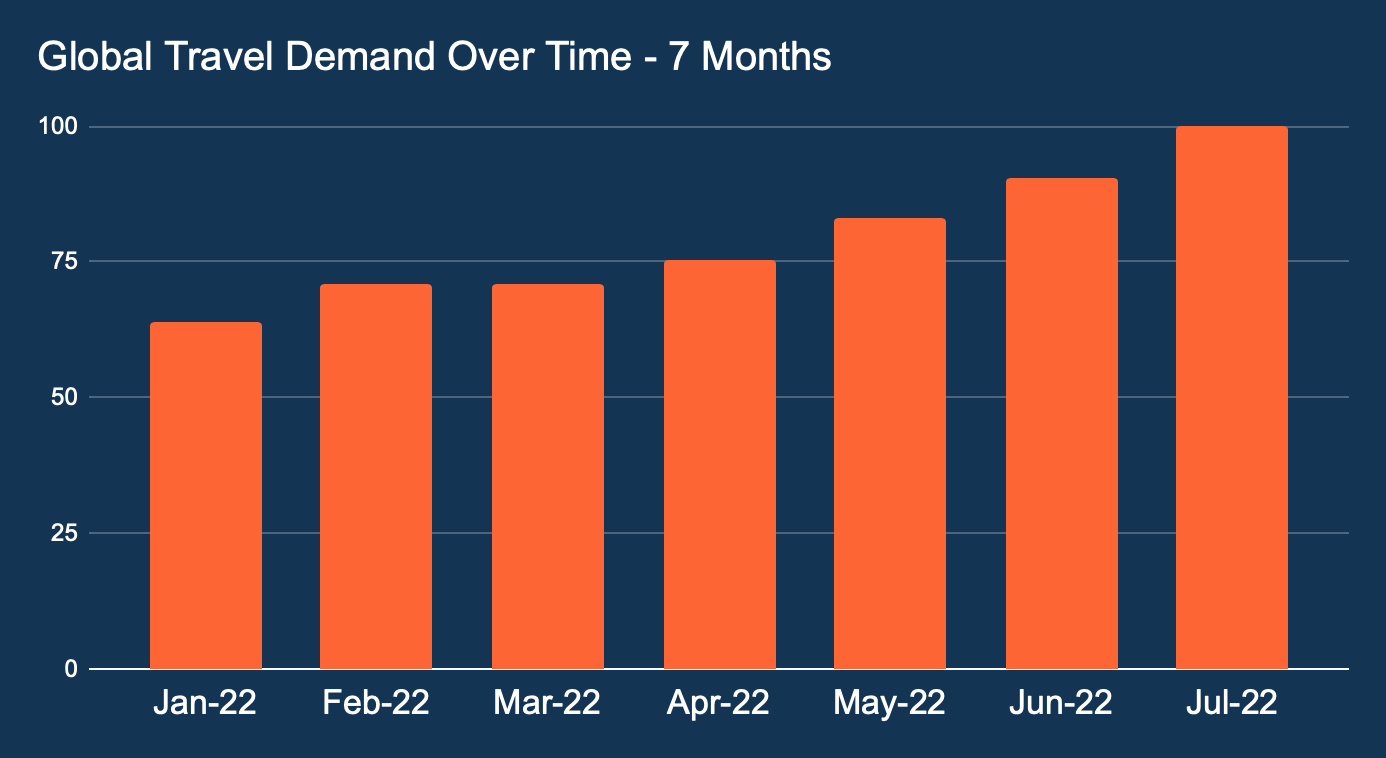
This graph shows global travel demand trends year-to-date compared to the last 7 months.
*All data is indexed. This tool uses search volume as a proxy for travel demand.
Metasearch demand continues to grow. Europe and the US summer season remains growth, especially leisure-oriented travel taking a dominance across these markets.
Meta Insights by Region
Americas
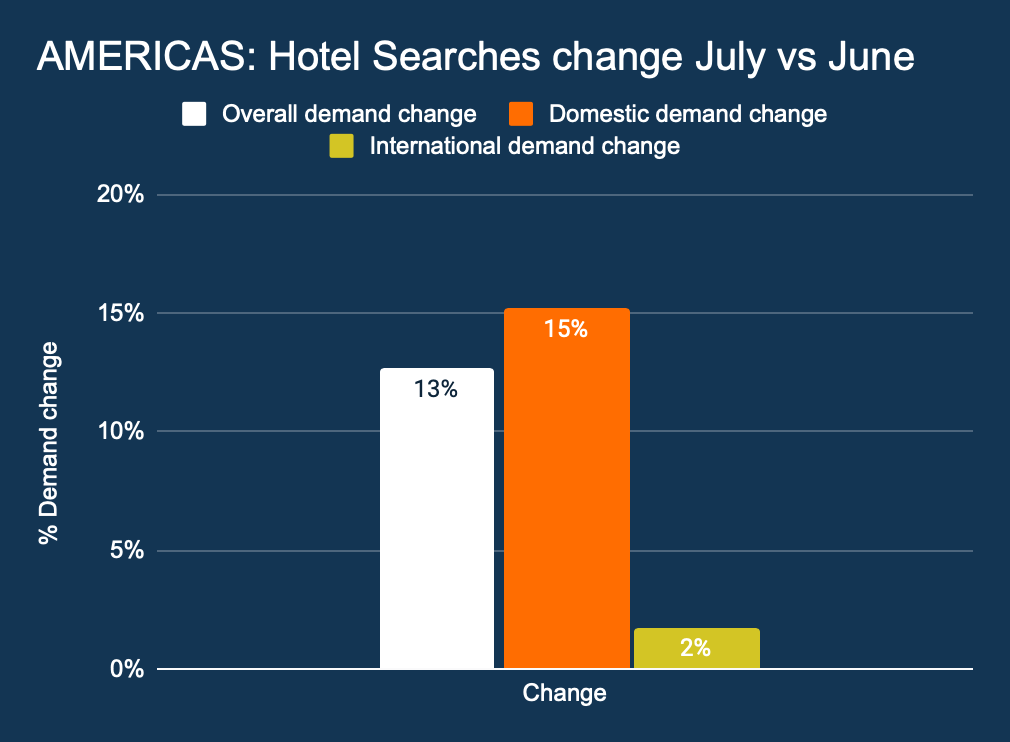
This graph shows the growth in overall hotel searches month on month, as well as the change in domestic and international hotel searches.
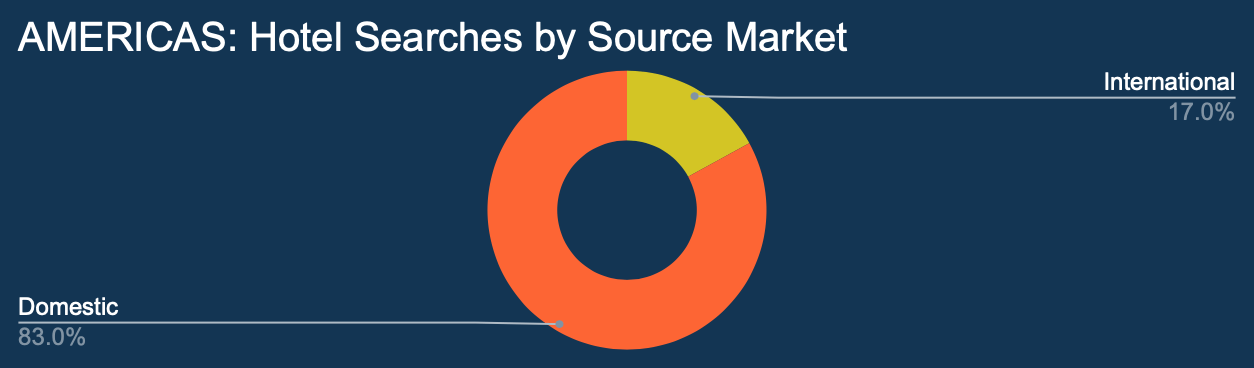
This graph shows all hotel searches by origin.
Growth has continued during July 2022, but surprisingly international travel demand has flattened month over month. US travellers favouring to remain closer to home for their summer travels.
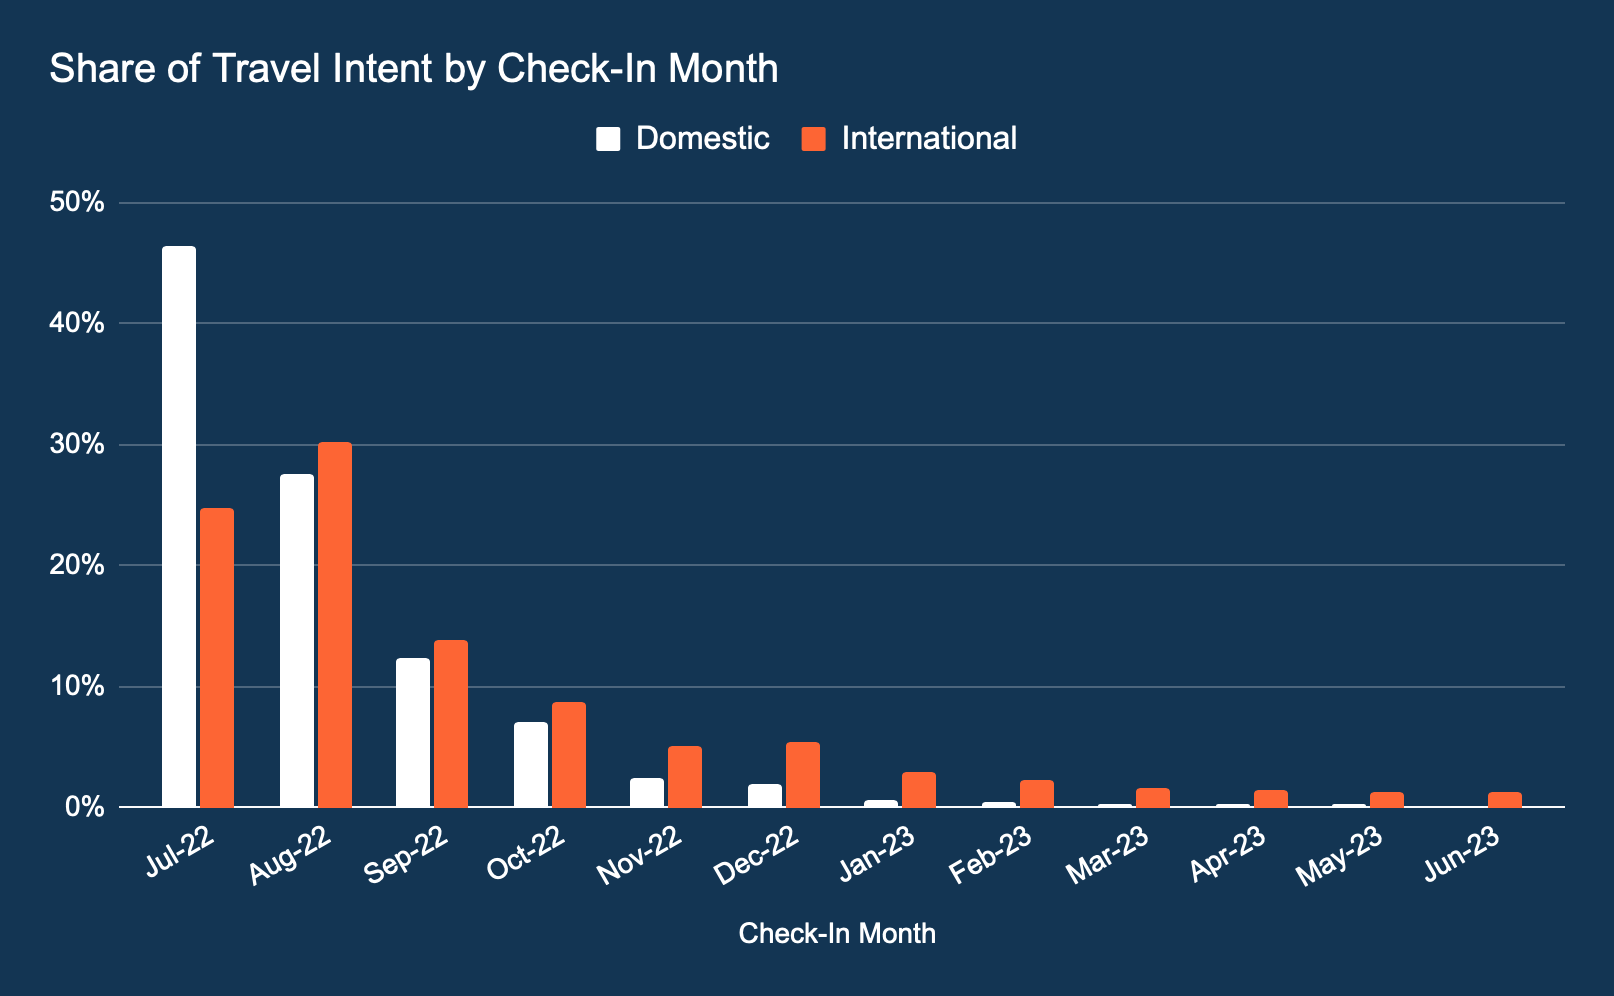
This graph shows the share of travel intent by check in month.
Travel intent looks to consolidate around a 90 day window albeit August stays look to favour more international travel opposed to domestic Americas only travel.
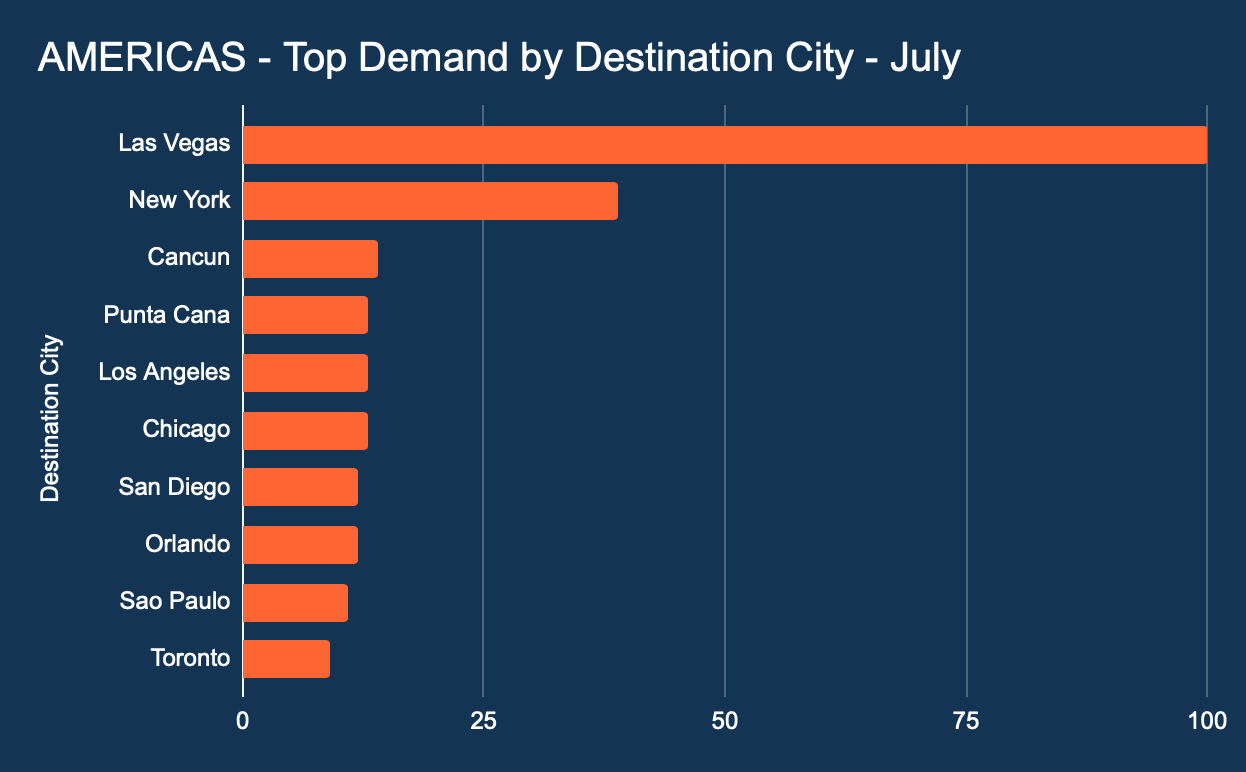
This graph shows demand by destination or city.
Las Vegas continues to lead the table with Los Angeles making the list suggesting summer travel at its peak.
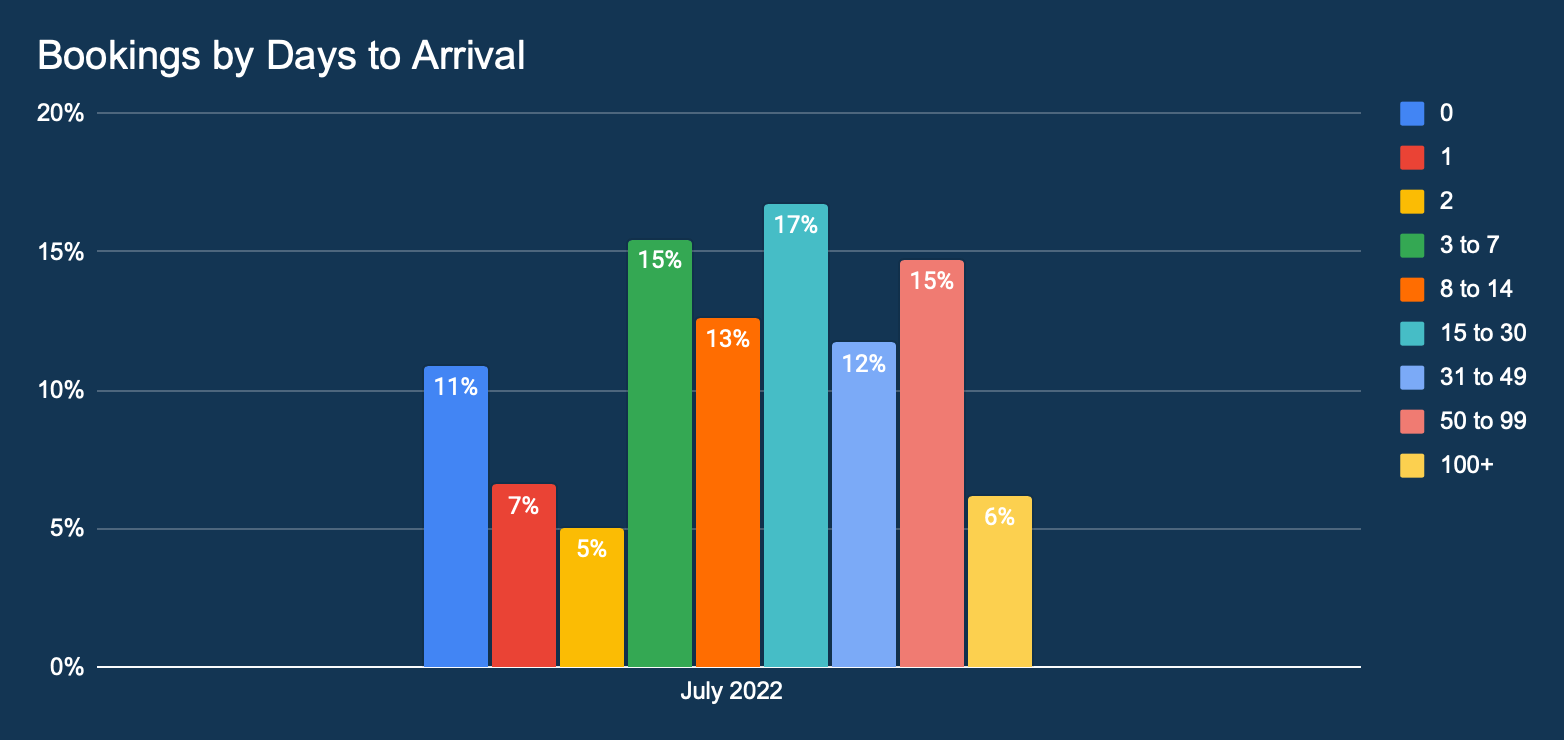
This graph shows the lead time distribution of all hotel bookings made in December 2021. The percentage indicates the proportion of bookings in comparison to the total number of hotel bookings.
The Americas’ travel intent data for July shows high demand for August stays which suggests strong demand for summer travel into August 2022 is still in play.
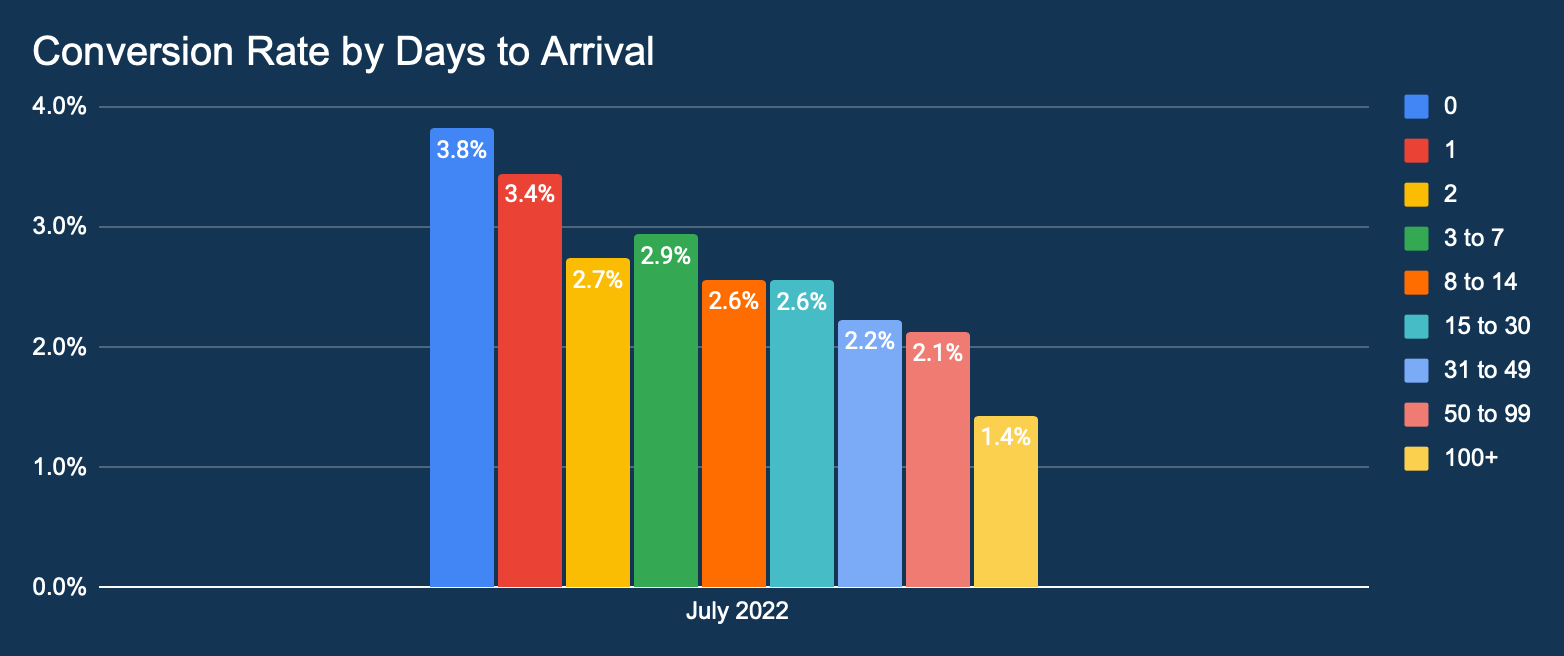
This graph shows the percentage distribution of conversion rates by lead time.
Going by the above conversion data, a vast majority are oriented towards last minute travel.
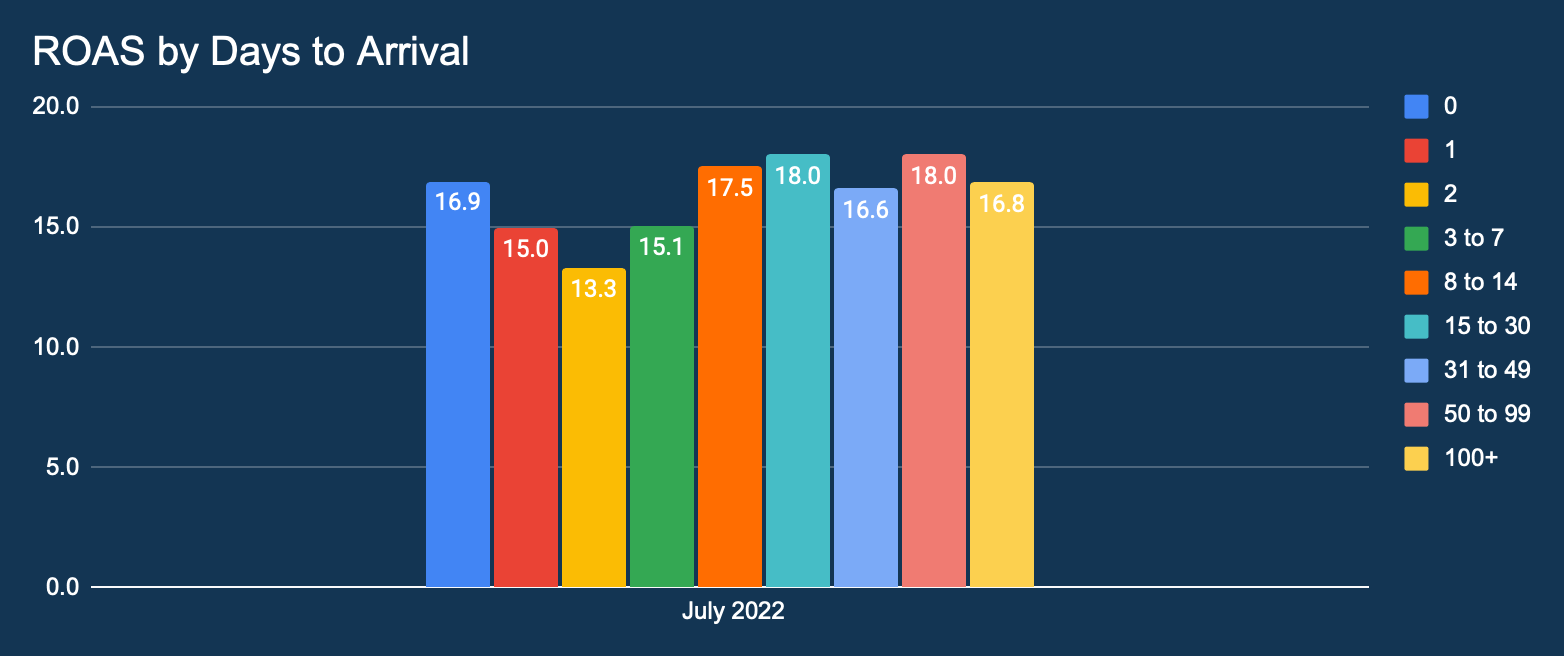
This graph shows the distribution of Return On Ad Spend (ROAS) in February 2022 by lead time.
Return On Ad Spend (ROAS) continues to be high, especially for longer lead time bookings. Metasearch continues to provide effective advertising for hoteliers.Unlike conversion data, Return On Ad Spend (ROAS) shows a stable picture. Longer lead times continue to perform well suggesting travellers who are looking to book further ahead have high travel intent.
EMEA
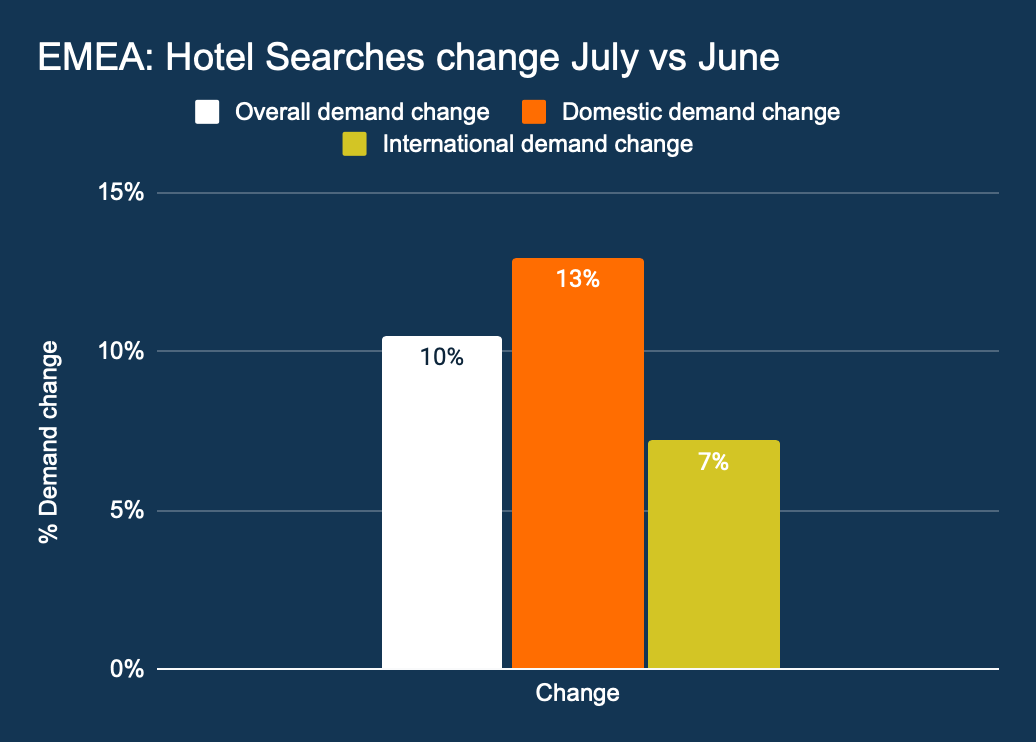
This graph shows the growth in overall hotel searches month on month, as well as the change in domestic and international hotel searches.
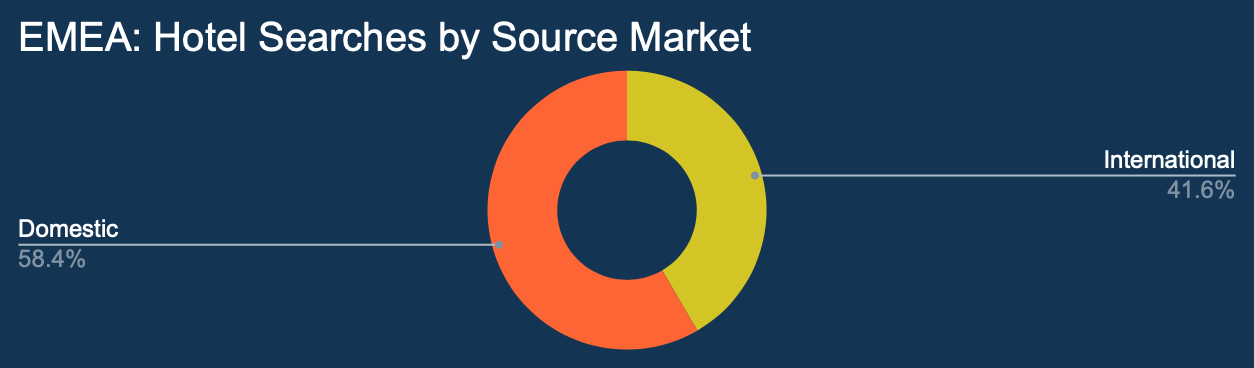
This graph shows all hotel searches by origin.
Overall hotel searches across Europe, the Middle East and Africa have actually increased for both domestic and international travel. The impact of ongoing war in Ukraine is appearing to be causing little impact to travel confidence.
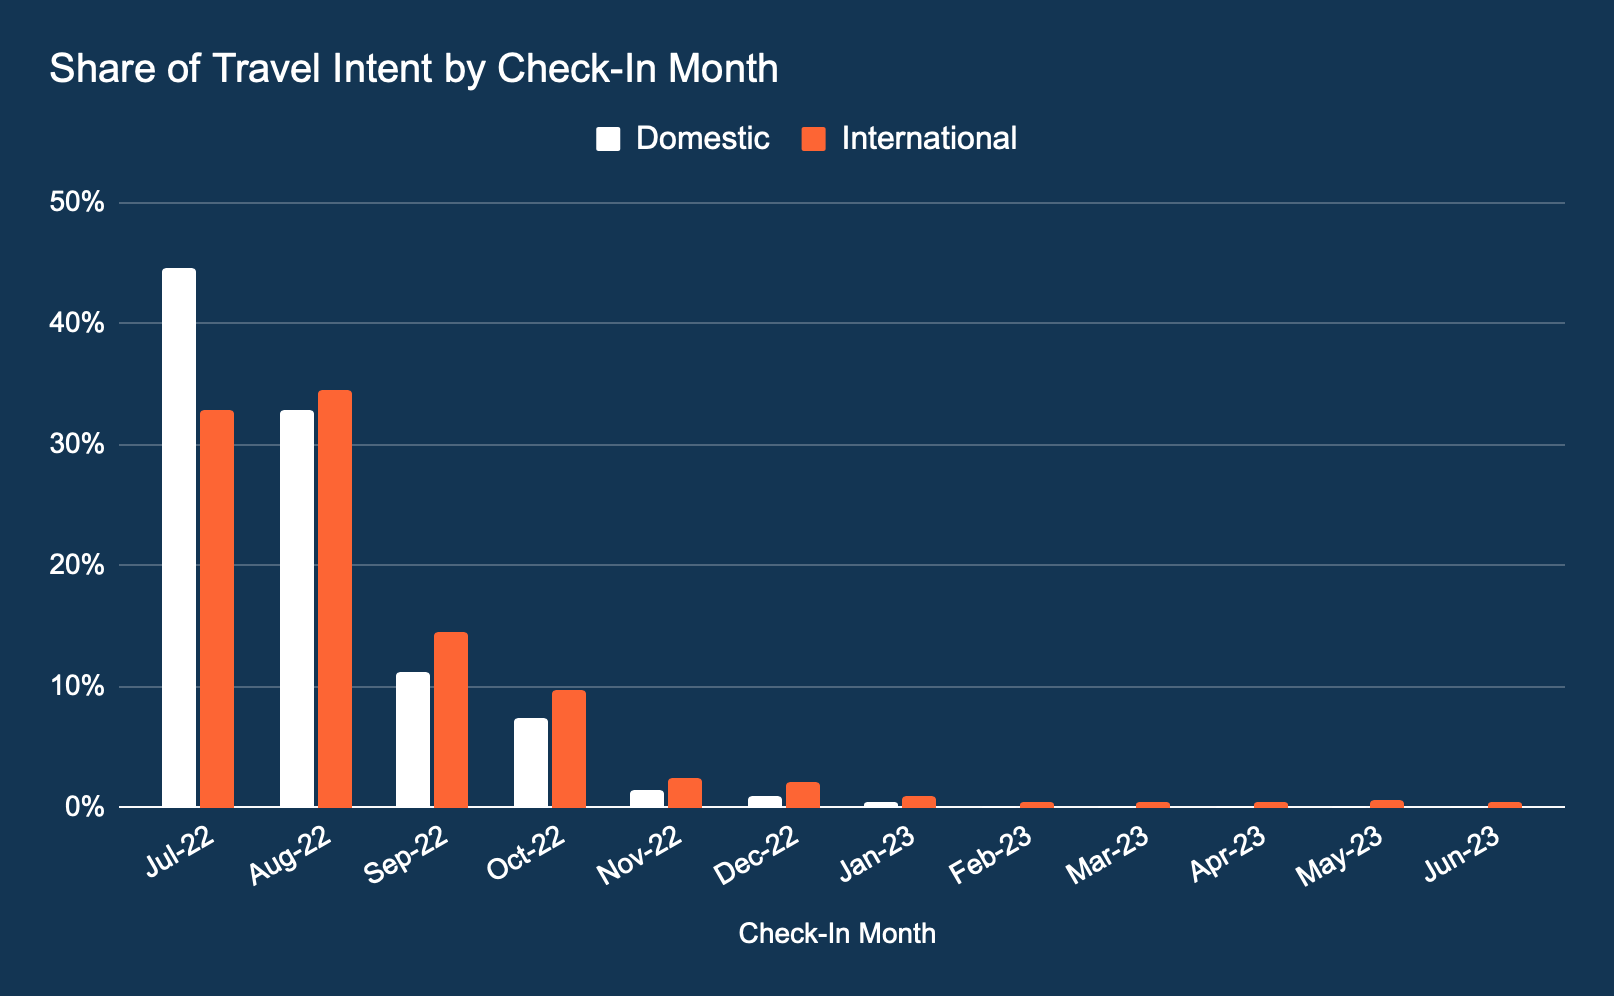
This graph shows the share of travel intent by check in month.
Unlike in the Americas, the share of international travel for future stays in August and September outperforms domestic stays. 0-60 days window of stay continues to dominateunl
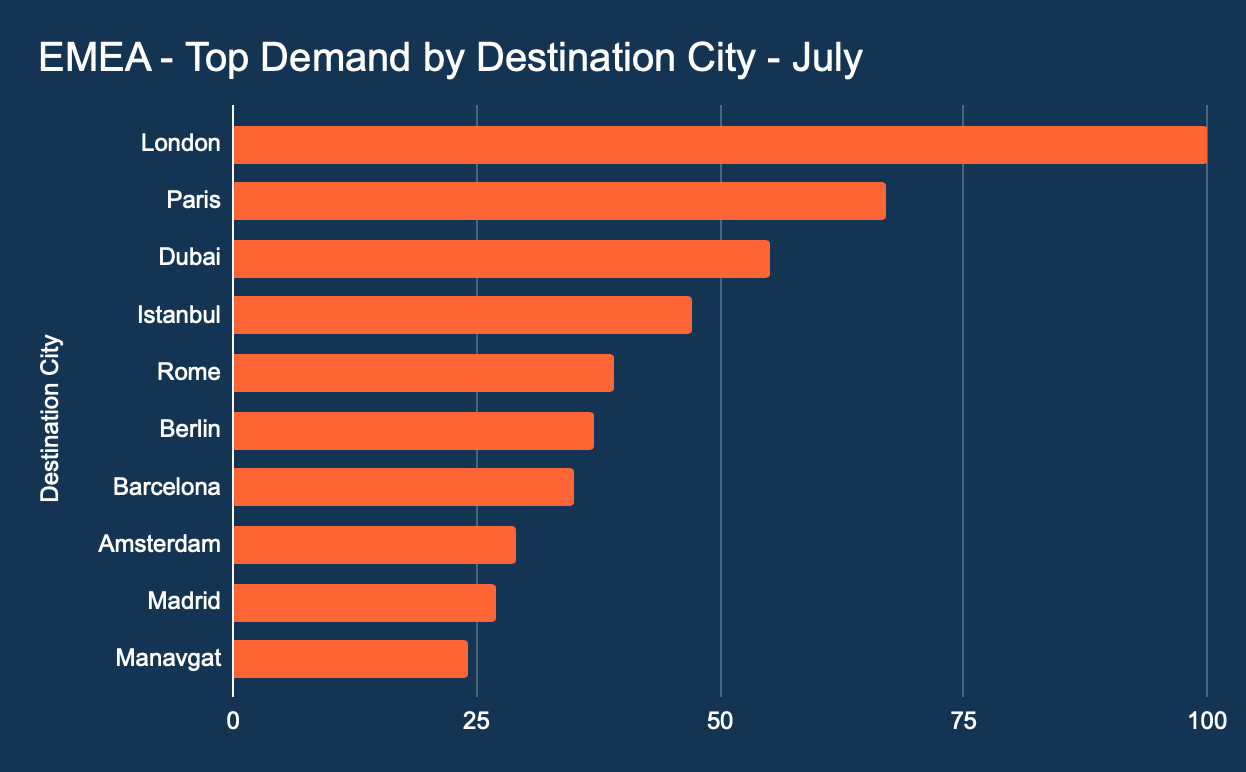
This graph shows demand by destination or city.
London continues to hold the top spot. Dubai and Istanbul remain in the top 10 but the real surprise is the Turkish city of Manavgat entering the frame which supports high leisure summer travel patterns.
This graph shows the lead time distribution of all hotel bookings made in July 2022. The percentage indicates the proportion of bookings in comparison to the total number of hotel bookings.
For the four-week period ending with 31 July 2022, 0-30 days travel patterns remain dominant which highlights travellers last minute buying patterns.
This graph shows the percentage distribution of conversion rates by lead time.
Last minute travel intent patterns remain evident going by 0-30 high conversion rates.
This graph shows the distribution of Return On Ad Spend (ROAS) in July 2022 by lead time.
Unlike conversion data, Return On Ad Spend (ROAS) continues to perform well way past the 100+ days. Hotels should focus on this chart especially to ensure they focus on longer lead time high intent travels to enjoy good Returns on their Spend.
APAC
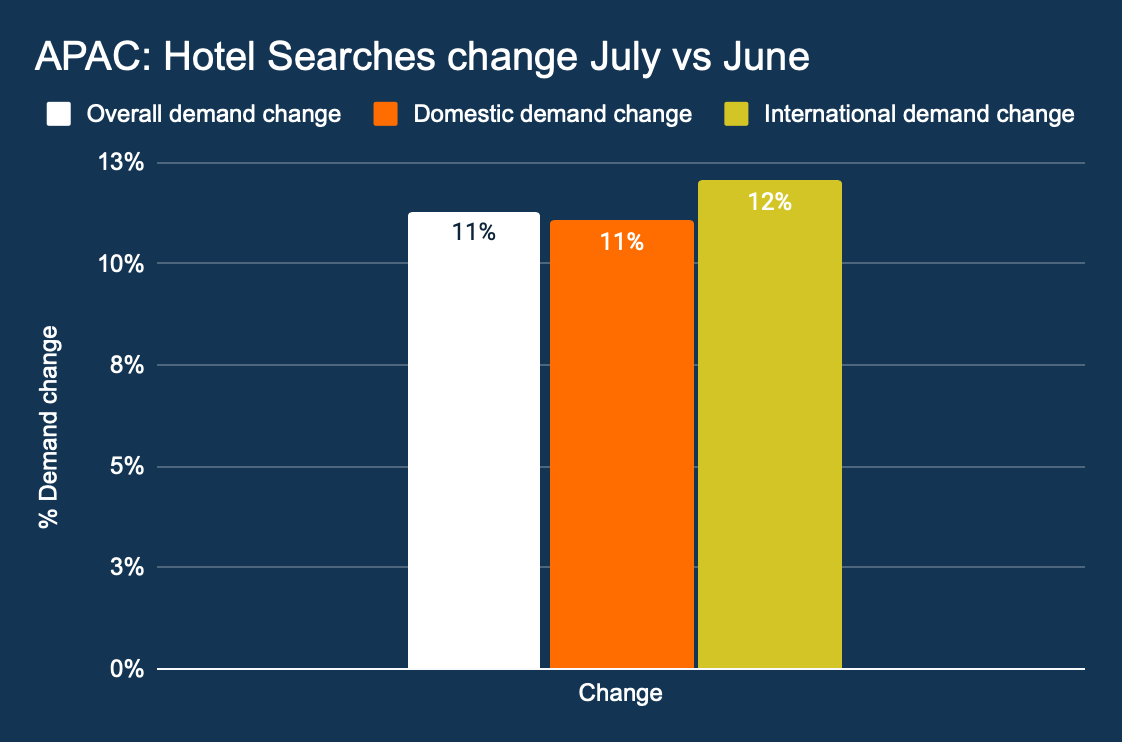
This graph shows the growth in overall hotel searches month on month, as well as the change in domestic and international hotel searches.
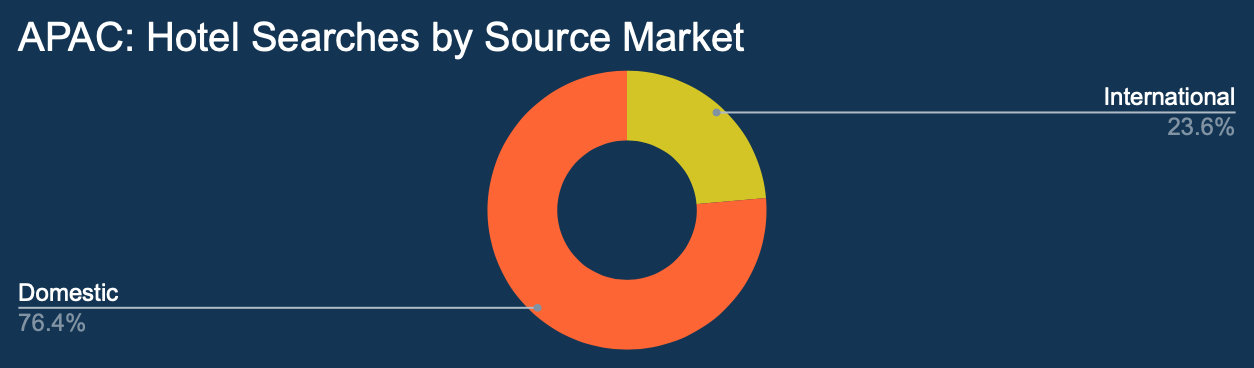
This graph shows all hotel searches by origin.
All indicators are that Asia Pacific travel recovery is progressing well. Although intra-regional travel dominates, data now indicates APAC travellers are travelling to further a field.
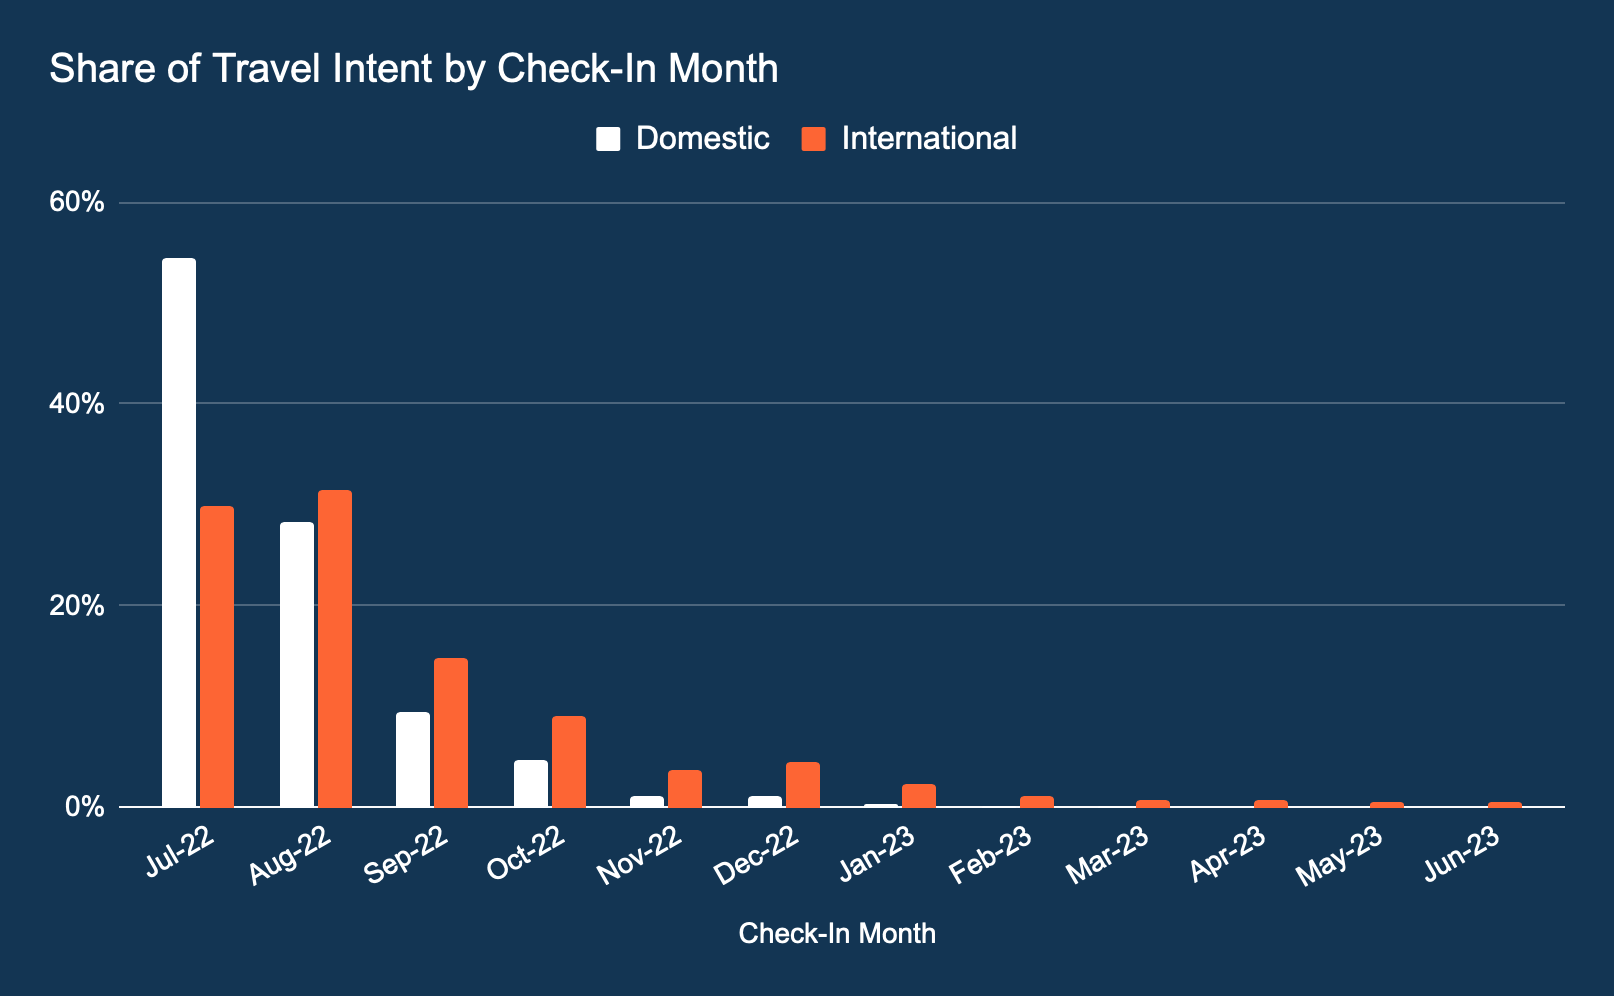
This graph shows the distribution of searched travel dates. The percentage indicates the proportioned part of every searched check-in month in comparison to the total hotel searches.
In contrast to previous months, international travel returning travel intent is keenest on check-ins between 0-90 days instead of 0-60days as seen previously. This a good sign as confidence is returning post Covid.
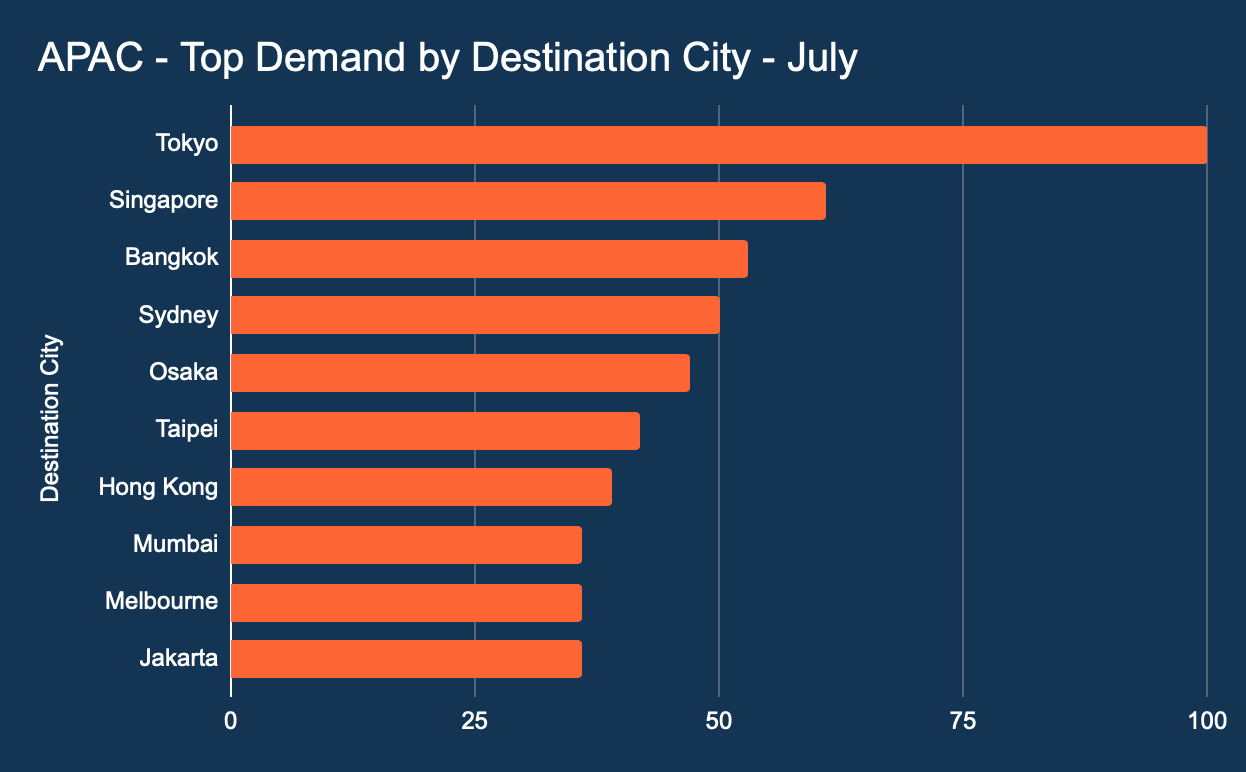
This graph shows demand by destination or city.
Tokyo occupies the top spot. Bangkok continues to improve. Sydney and Melbourne’s continuous presence indicate good signs travellers are looking to spend time in Australia.
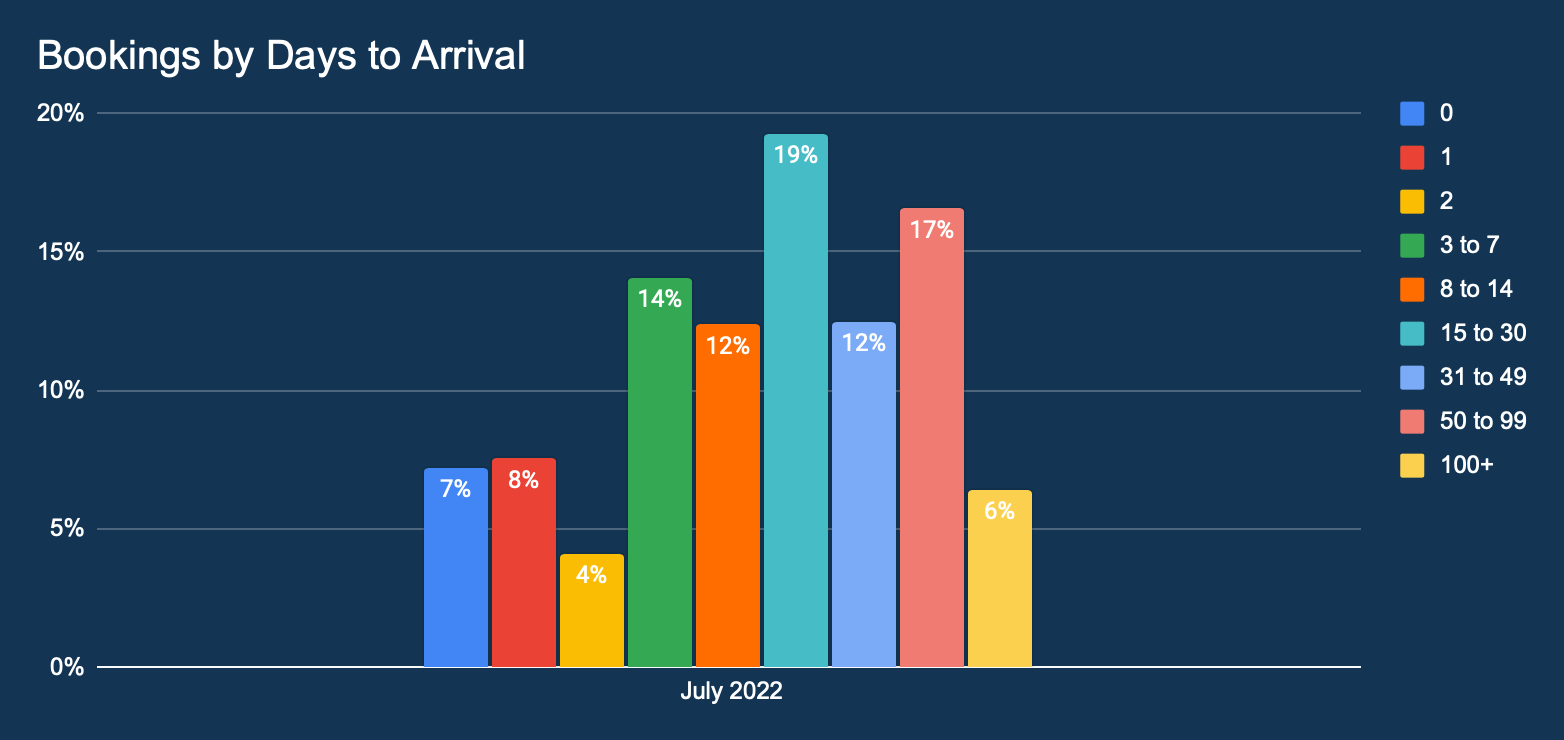
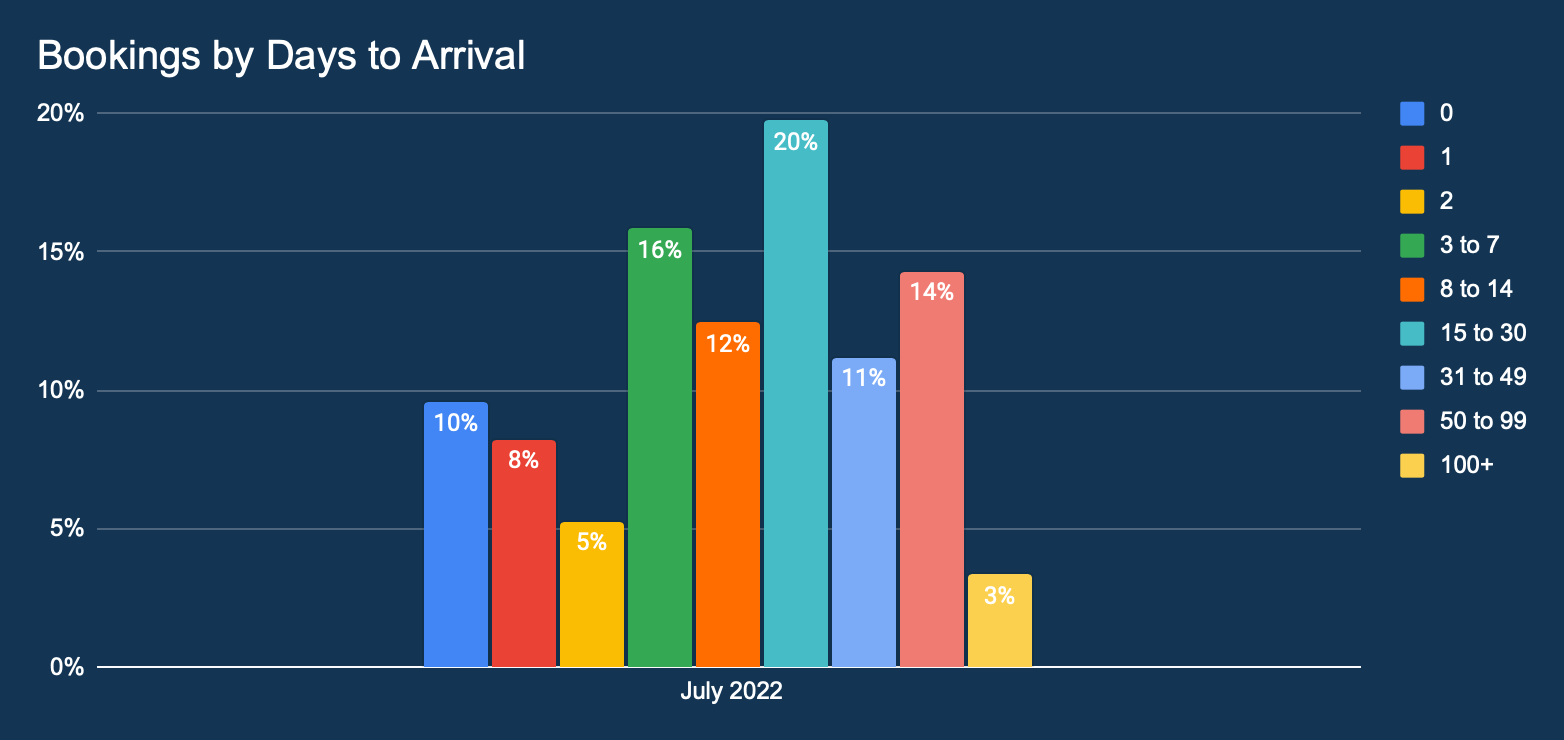
This graph shows the lead time distribution of all hotel bookings made in December 2021. The percentage indicates the proportion of bookings in comparison to the total number of hotel bookings.
Data on Bookings by Days to Arrival for APAC is quite sporadic but beyond 50 days to arrival is showing strong which suggest APAC travellers are starting to shift to longer lead times when booking travel.
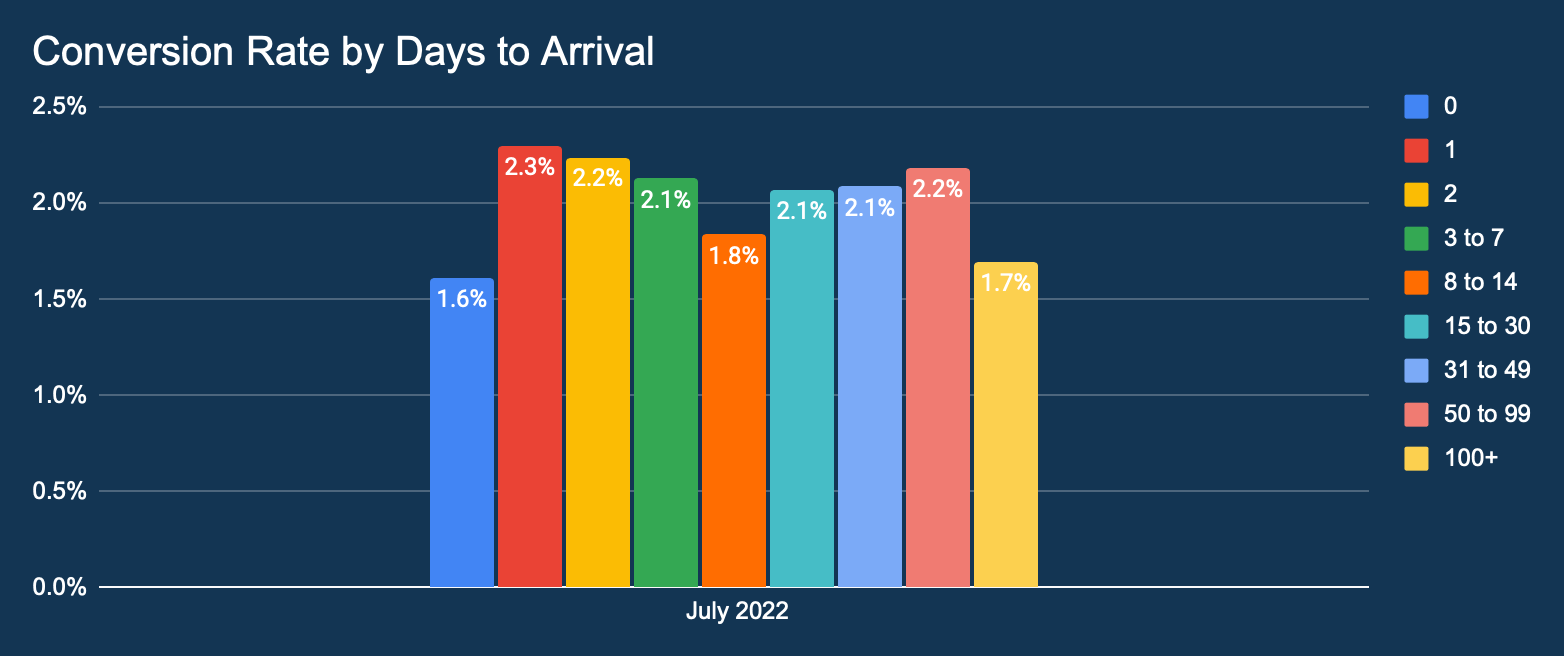
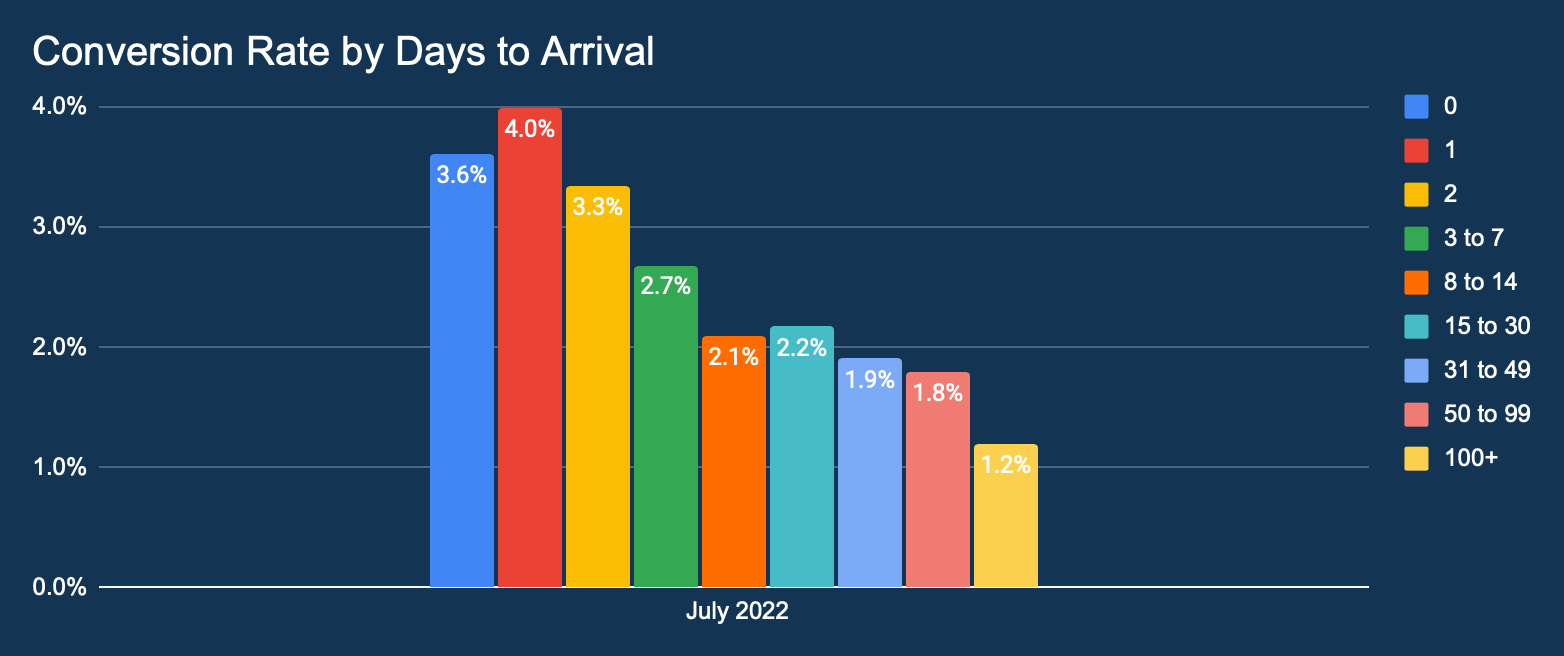
This graph shows the percentage distribution of conversion rates by lead time.
Average conversion rate of 2% across days to arrivals remains stable.
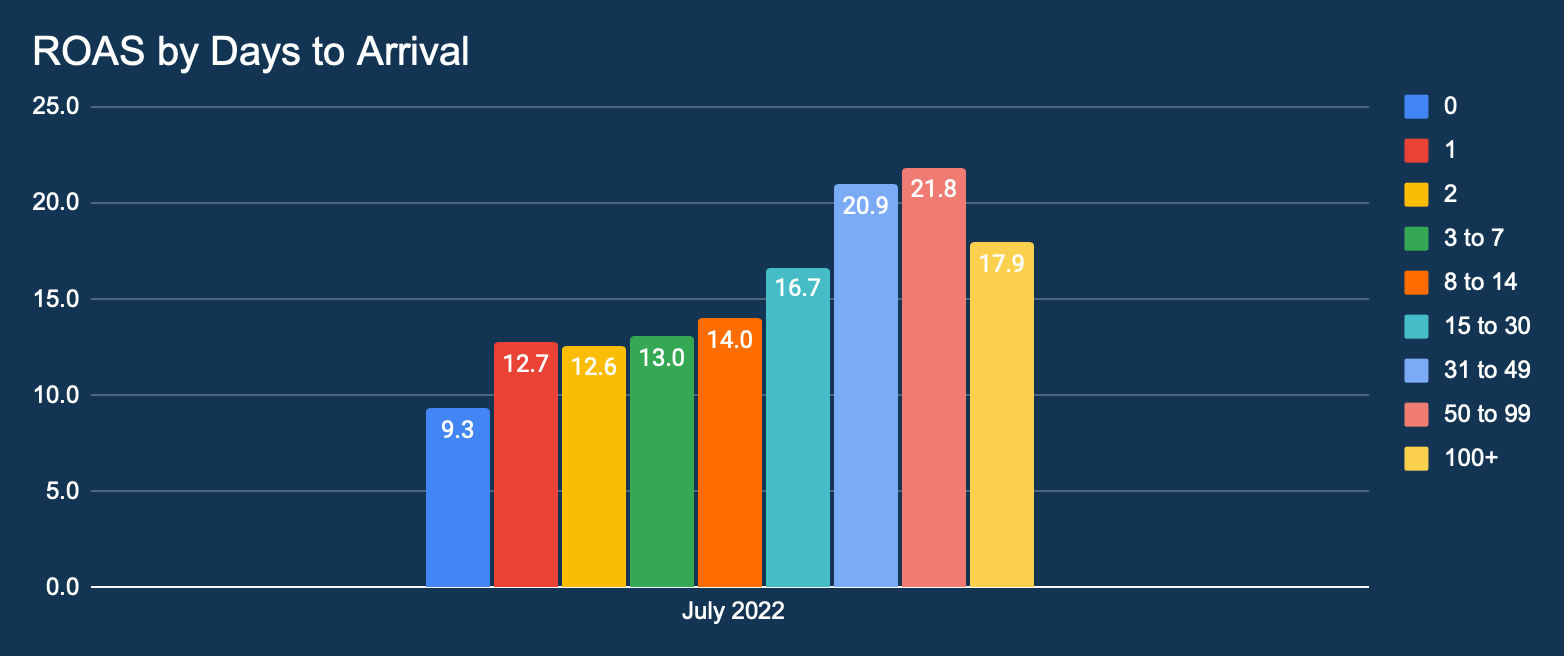
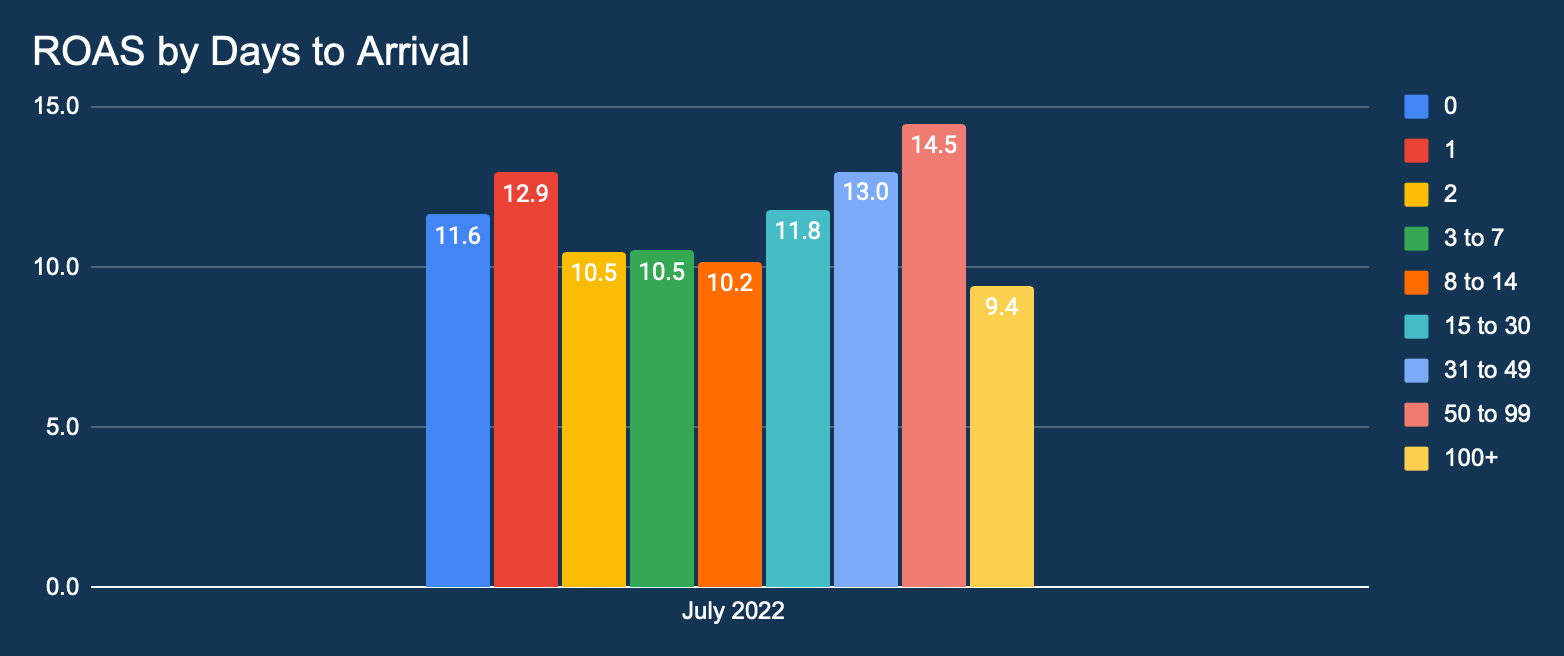
This graph shows the distribution of Return On Ad Spend (ROAS) in December 2021 by lead time.
This chart data is crucial for hotels to plan ahead, especially with their media spend and focus on longer lead time customers. Hotels will get much better returns by capturing customers who book 60days and beyond.
About Marketing Services by DerbySoft
We’ve been helping the hotel sector for many years to use data and digital to build successful businesses. Competition has never been fiercer, margins never finer and driving bookings never more complex.
Simple marketing activity is not enough. To get the most from your budget; strategies, campaigns and decisions need to be smarter and more accurate.
To achieve this we have built intelligent technologies that will optimise your budget, audience, channels and results; producing multi-channel campaigns that just work, in your hands or in ours. DerbySoft offers digital marketing hotel expertise, enhanced by intelligent technology.
Have any questions?
If you would like to see more information or need any specific insights for your hotel country or source market, contact us.