Global Meta Insights – May 2022 Edition
Is the possibility of an economic downturn likely to knock confidence in travel?
We continue to monitor travel and metasearch demand trends, total hotel searches, bookings and conversion rates across all metasearch channels globally to bring you valuable insights to assist hotels in identifying future opportunities for your business.
The increased rates of travel demand seen in the first four months of 2022 continues into May 2022.
In Europe, summer travel demand continues albeit the conflict in Ukraine and cost of living crisis continues to bother households.
Nevertheless, there is reason to be cautious with many UK airports seeing cancellation in recent weeks – UK data shows demand for UK internal travel markets rose significantly.
On the other hand, US travellers’ eyes travel further afield with international travel seeing 15% growth month over month.
In Asia Pacific, Omicron continues to cause challenges in China. However, the rest of Asia Pacific travel demand saw significant increases in May over April 2022. With restrictions easing across Australia & New Zealand, demand gathers pace. Sydney & Melbourne entering the top ten high in demand cities in APAC is encouraging signs.
Source: Google Destination Insights
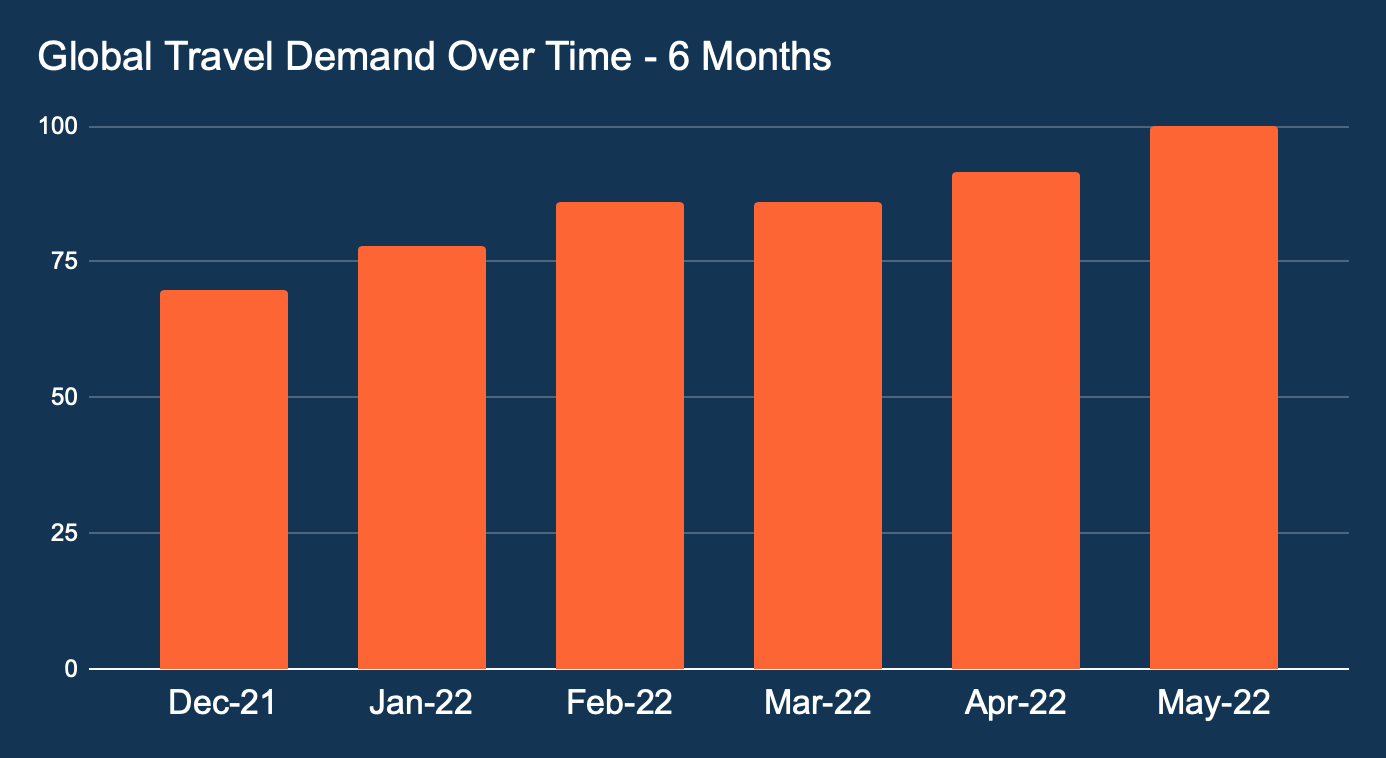
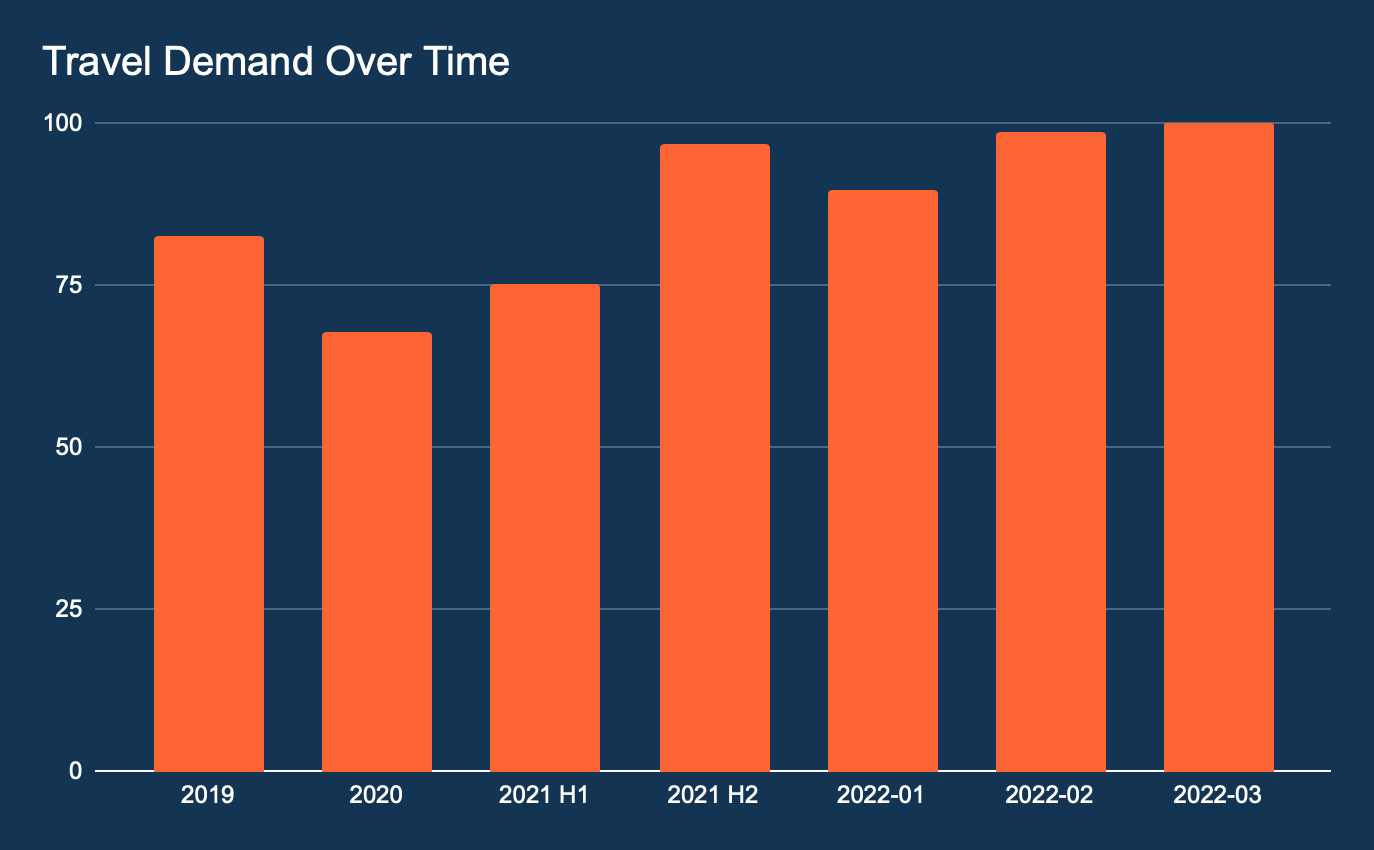
This graph shows global travel demand trends year-to-date compared to the last 6 months.
*All data is indexed. This tool uses search volume as a proxy for travel demand.
Travel demand reached its 6-month peak during May 2022, with a marginal increase from April. Such an unusually busy first quarter booking season may be caused by the continuing relaxation of COVID laws around the globe, including softening regulations for unvaccinated travellers.
Meta Insights by Region
Americas
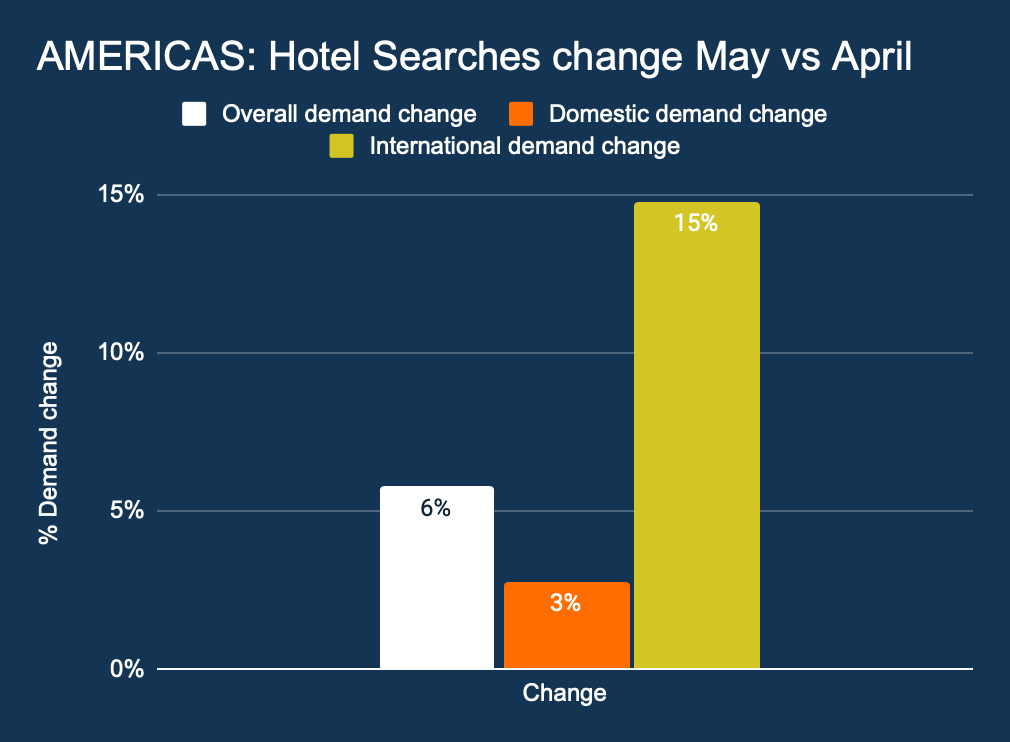
This graph shows the growth in overall hotel searches month on month, as well as the change in domestic and international hotel searches.
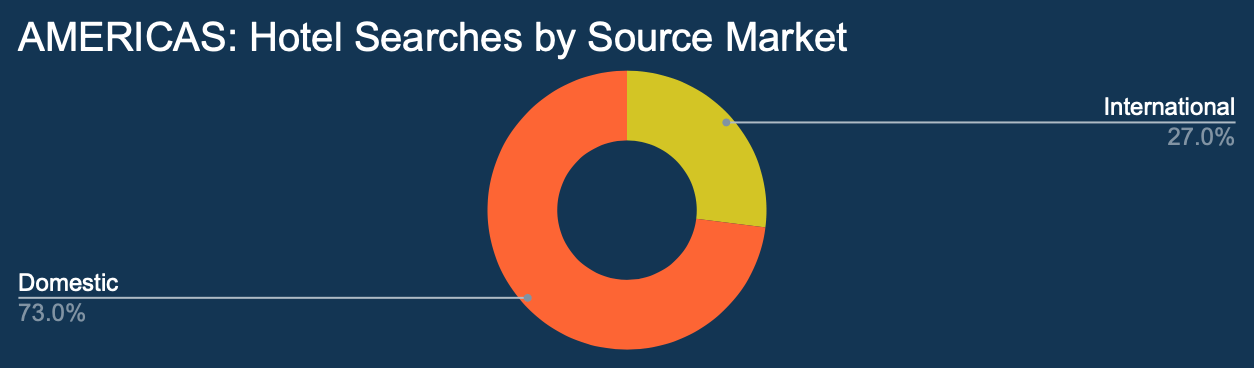
This graph shows all hotel searches by origin.
Growth has continued during May, but unsurprisingly the high level of growth in International demand is encouraging. Month over month demand increased by 6%, with a stable 3% increase in domestic, and a 15% increase in international demand.
The possibility of an economic downturn seems more real than ever although the data does not show a slow down in travel confidence.
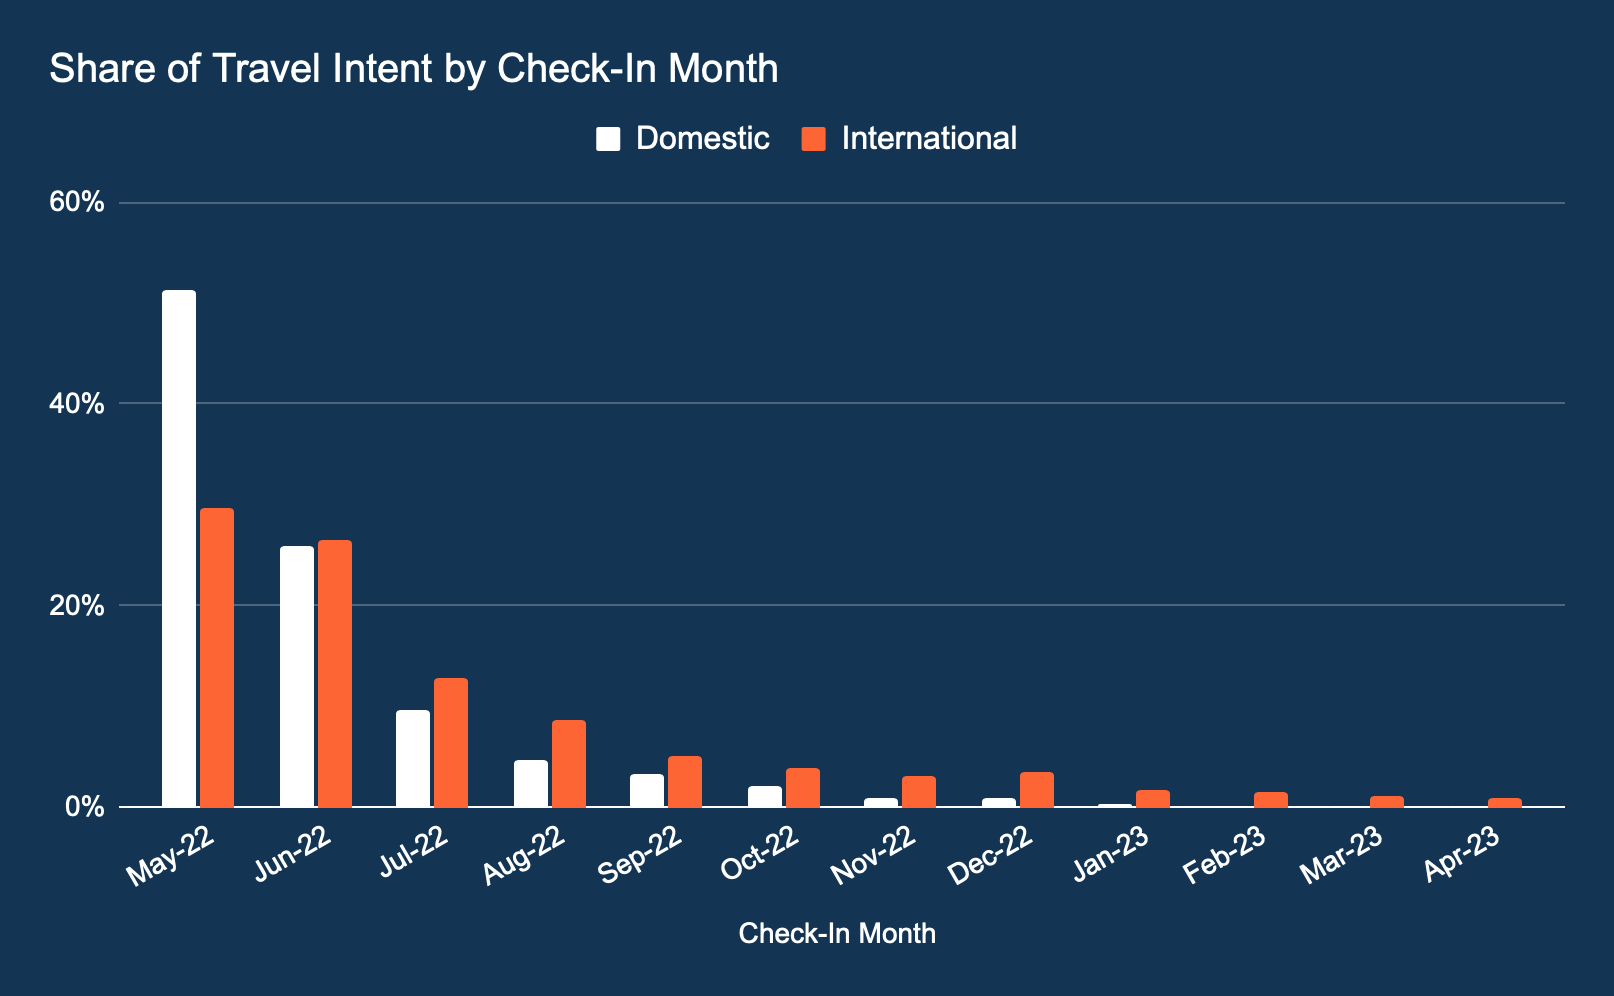
This graph shows the share of travel intent by check in month.
Travel intent with a check in date within 60 days continues and the share of international travel intent within 60 days grew marginally. An interesting observation is that international travel intent with a lead-in 90 days was higher than international travel intent 0-30 days in advance. Might this be a sign that international travel is returning? We think so.
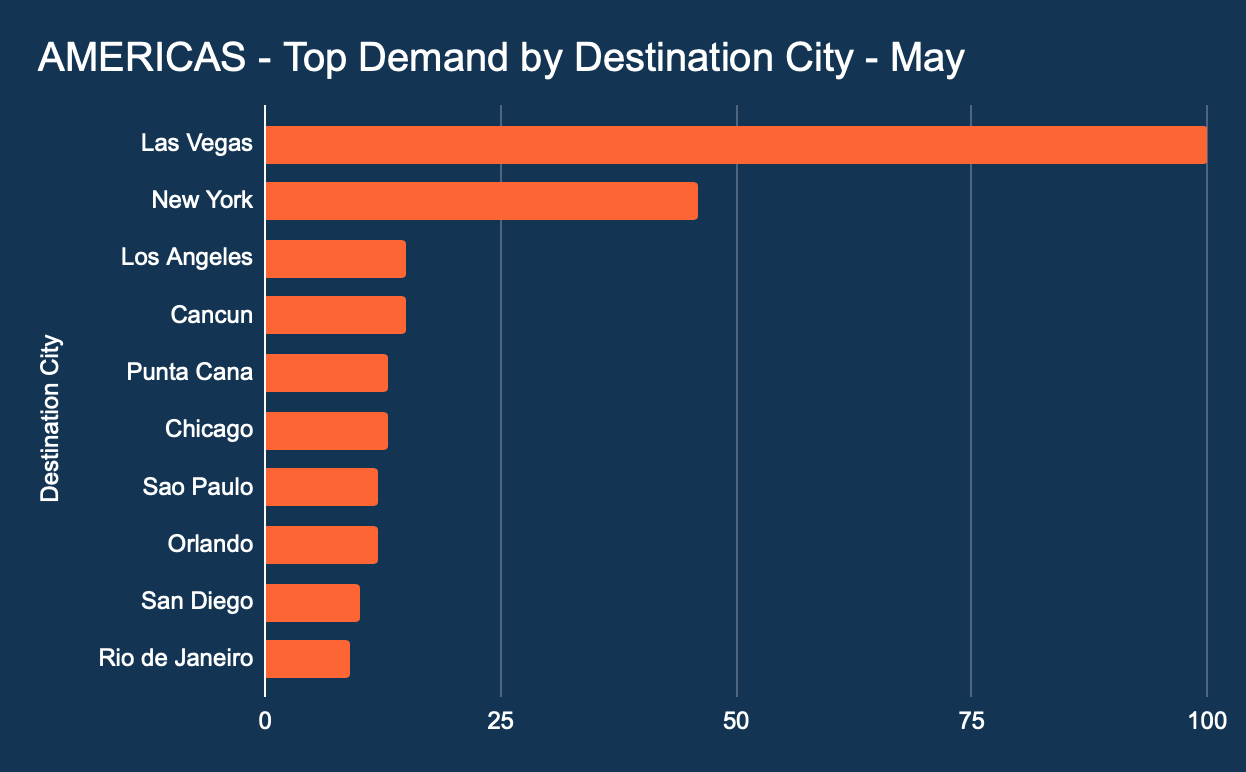
This graph shows demand by destination or city.
Las Vegas continues to lead the table. Rio de Janeiro enters the top ten for the first time.
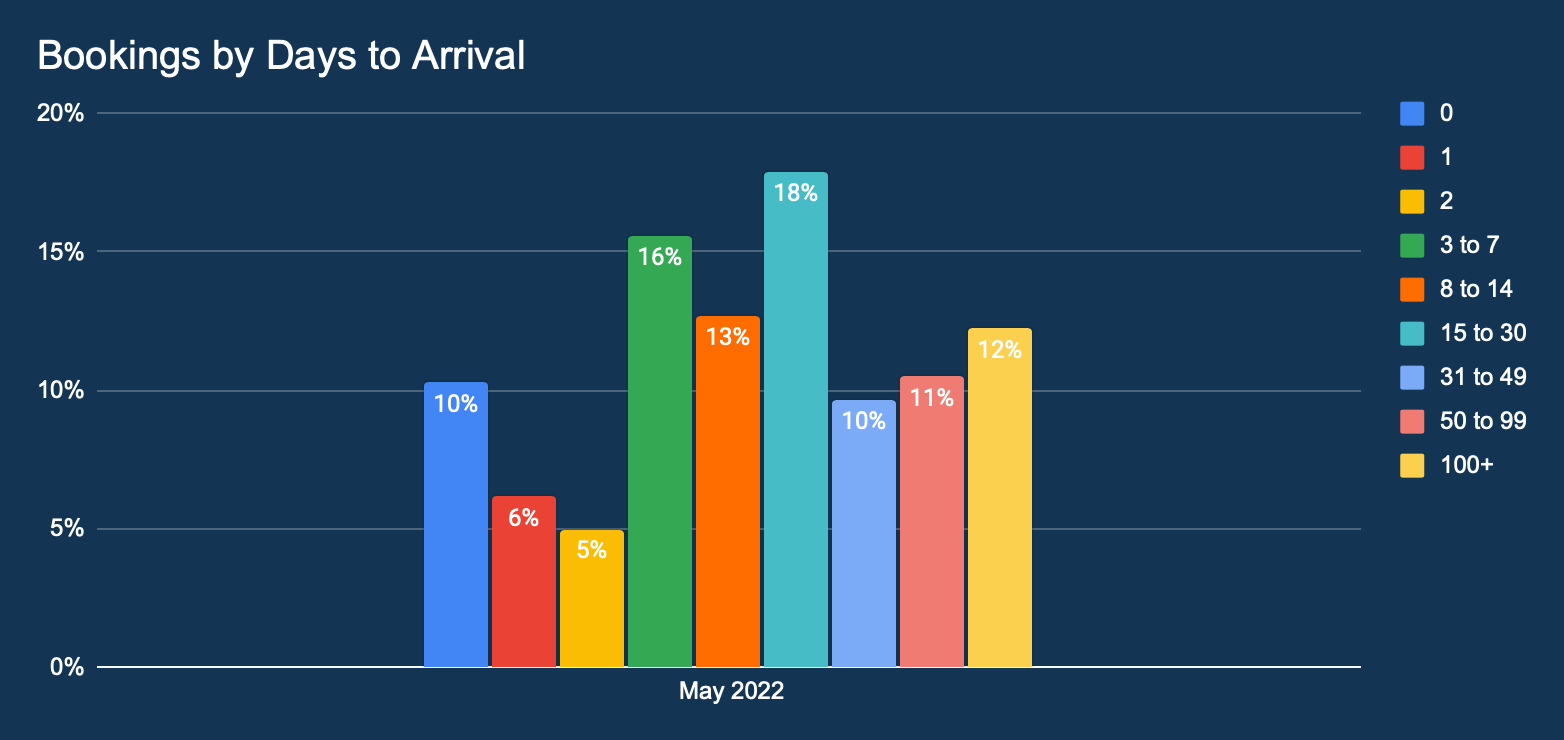
This graph shows the lead time distribution of all hotel bookings made in December 2021. The percentage indicates the proportion of bookings in comparison to the total number of hotel bookings.
The Americas’ travel intent data for May has balanced out significantly when compared with starting in January 2022. Bookings made 31-49, and 50-99 days in advance may equate to an improvement in traveller confidence and traditional long-term holiday planning is back on the agenda.
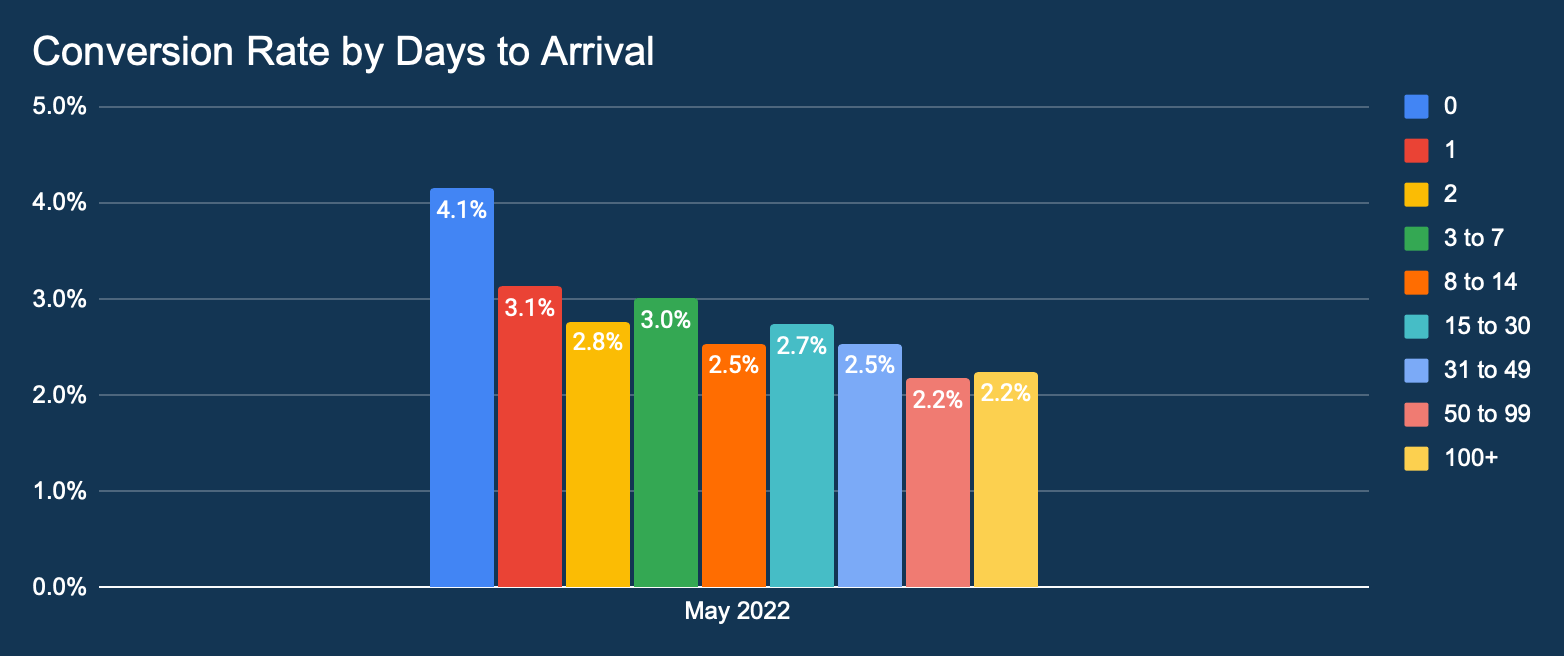
This graph shows the percentage distribution of conversion rates by lead time.
Bookings for 0-2 stays saw conversion rate increases month over month. This is good news for hotels to sell their last remaining inventory at higher average booking value and achieve higher occupancy. Booking conversion stabilises for the rest of the days to arrivals which allows hoteliers to forecast better and allocate budgets according to their needs.
This graph shows the distribution of Return On Ad Spend (ROAS) in February 2022 by lead time.
Return On Ad Spend (ROAS) continues to be high, especially for longer lead time bookings. Metasearch continues to provide effective advertising for hoteliers.
EMEA
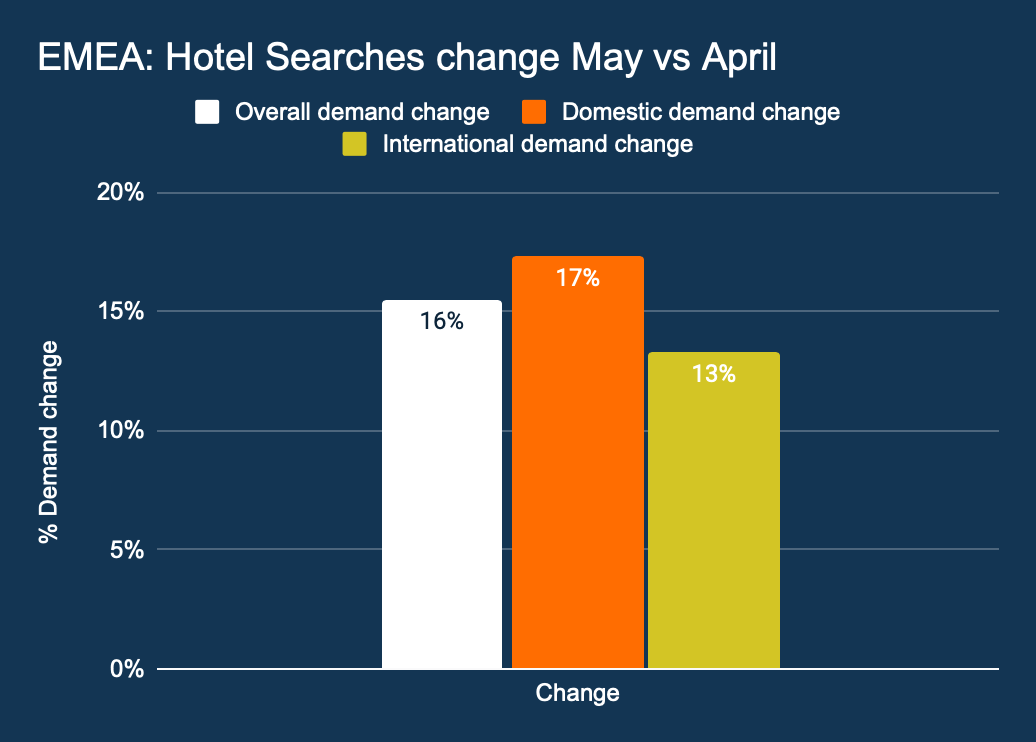
This graph shows the growth in overall hotel searches month on month, as well as the change in domestic and international hotel searches.
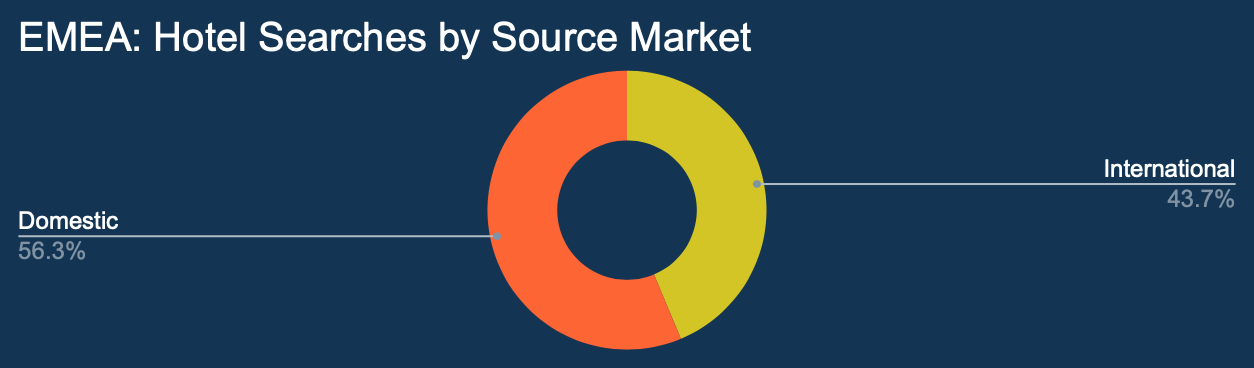
This graph shows all hotel searches by origin.
Overall hotel searches across Europe, the Middle East and Africa have actually increased for both domestic and international travel. The impact of ongoing war in Ukraine is appearing to be causing little impact to travel confidence.
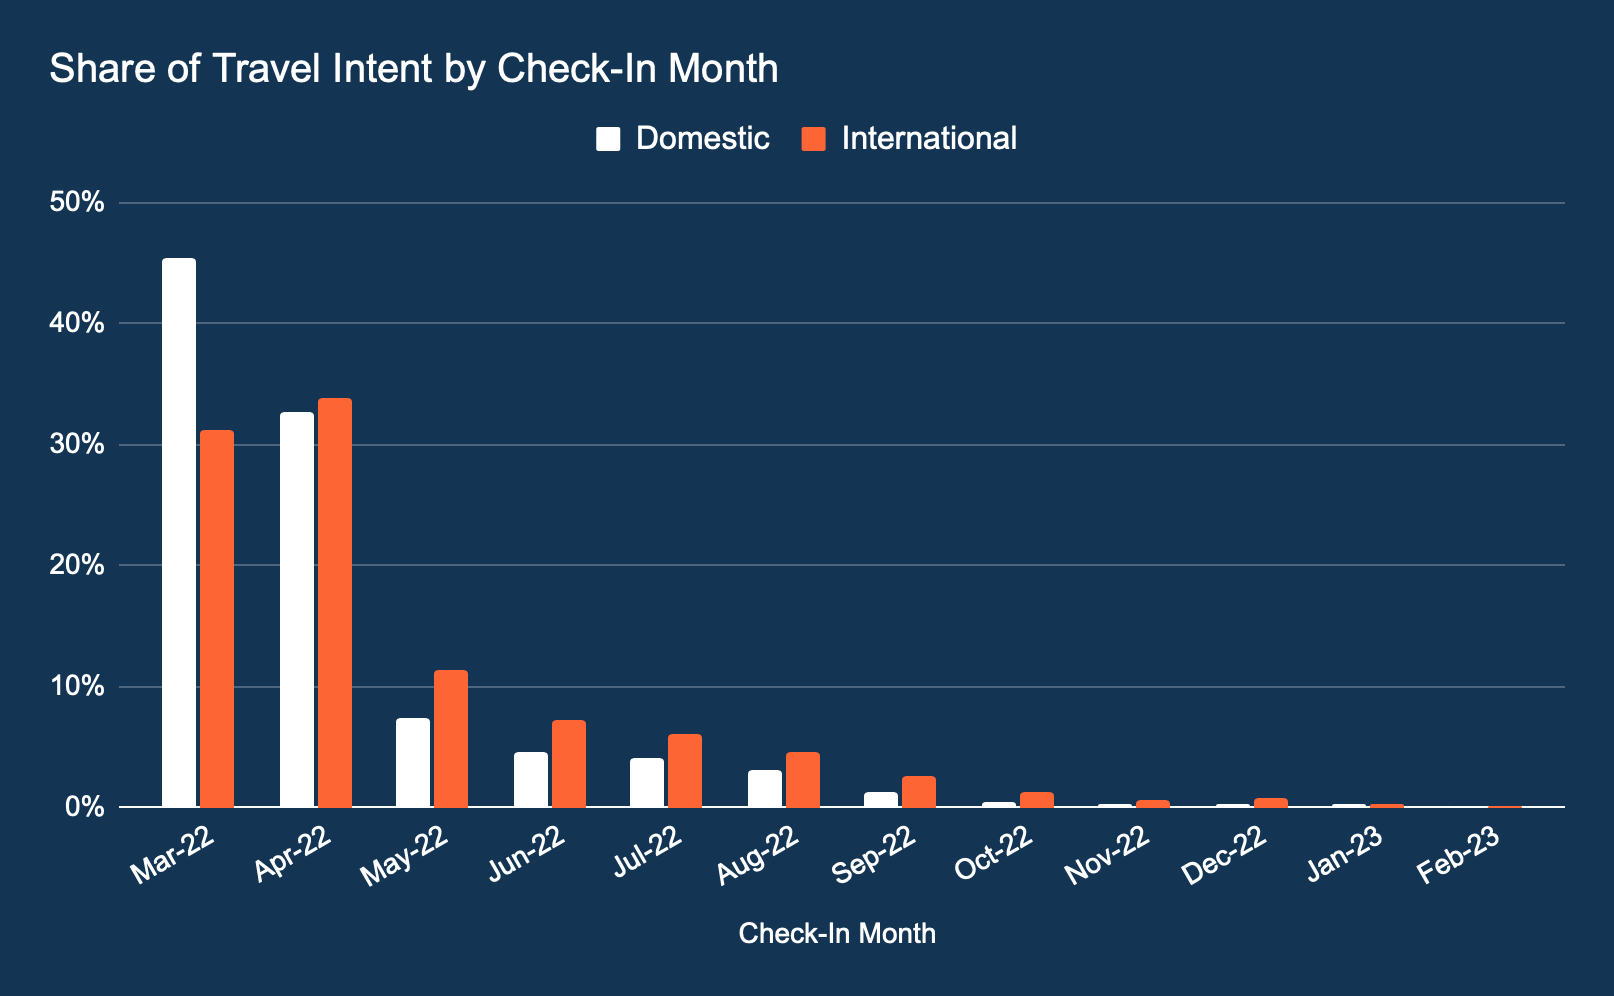
This graph shows the share of travel intent by check in month.
Like in the Americas, the share of international travel intent by check-in month peaks for 0-60 days away. There is a marked increase of International travel beyond June which is summer travel related.
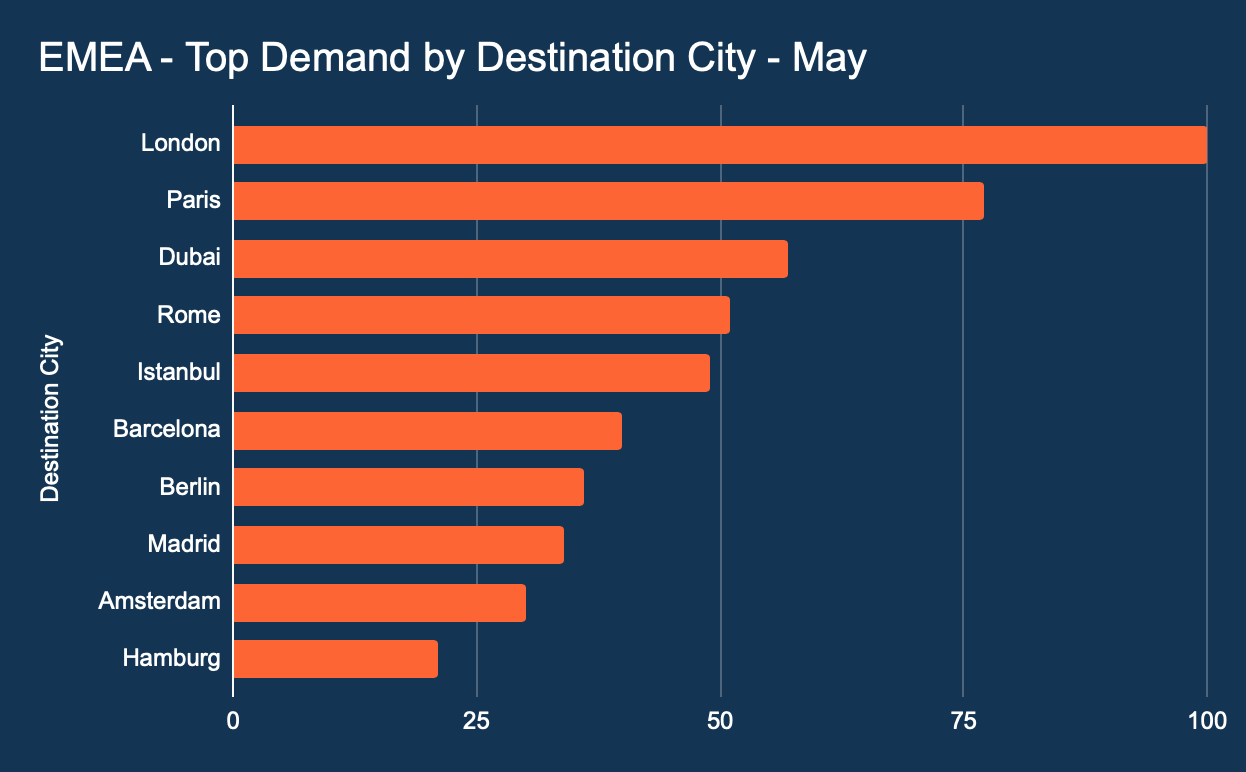
This graph shows demand by destination or city.
London holds the top spot. Hamburg replaces Dublin which has dropped off post St. Patrick’s Day celebrations.
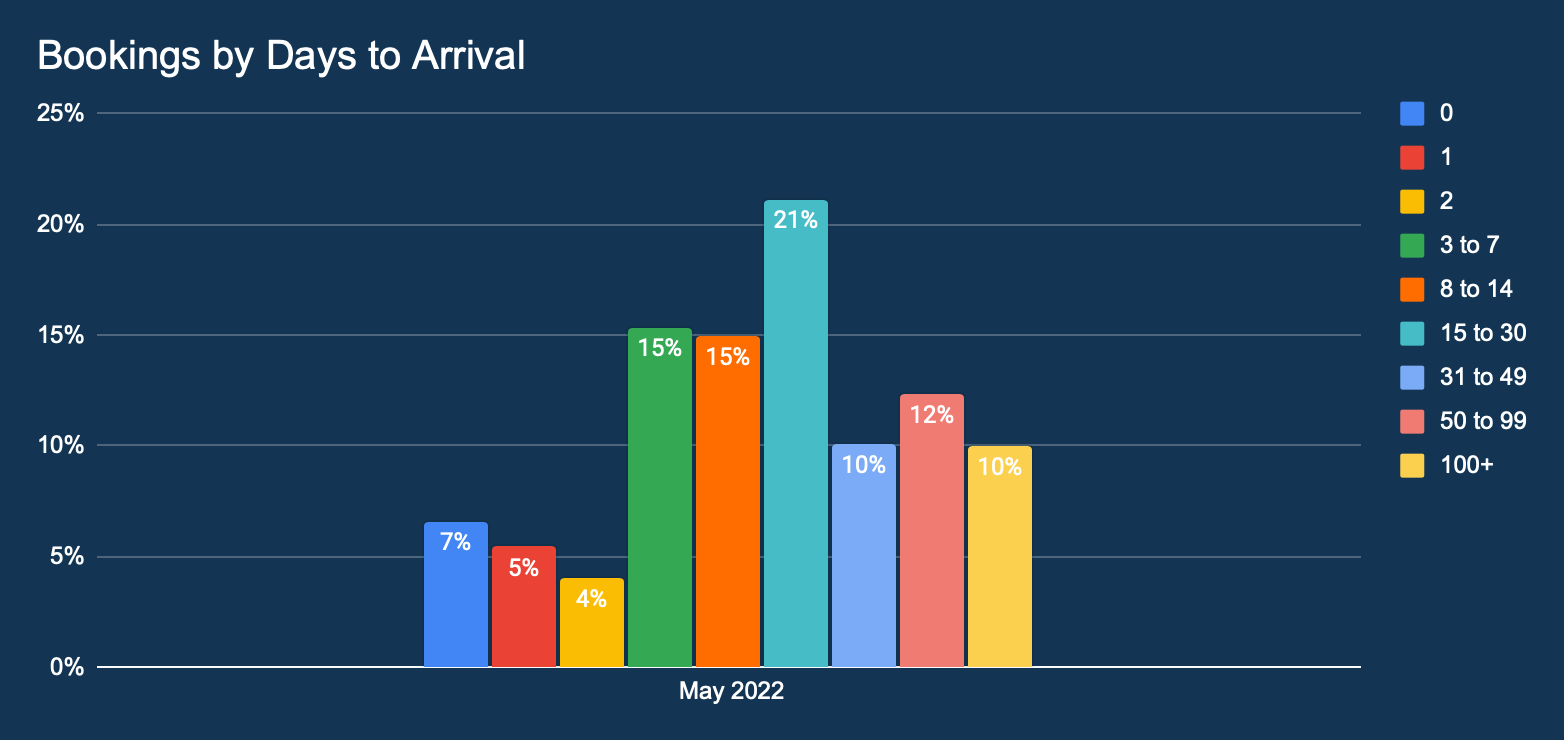
This graph shows the lead time distribution of all hotel bookings made in December 2021.
Not much has changed in April over May. Bookings were most common from 3-30 days into the future. Outside of this range, the lead time distribution beyond this were limited to 30% of total bookings.
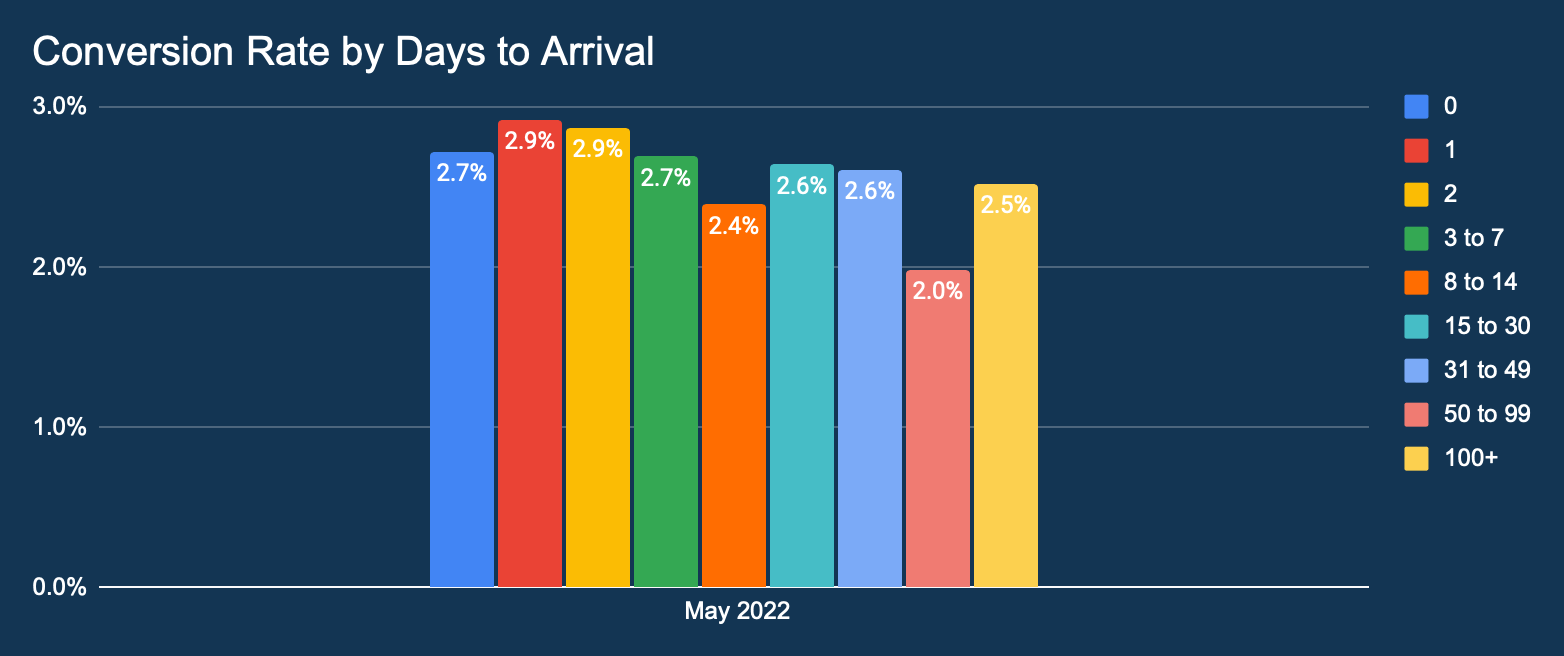
This graph shows the percentage distribution of conversion rates by lead time.
Conversion rates are slightly down in May over April and that may relate to hotel inventory for summer months depleted. Last minute booking conversion continues to be evident which suggests travellers booking behaviour is still somewhat last minute.
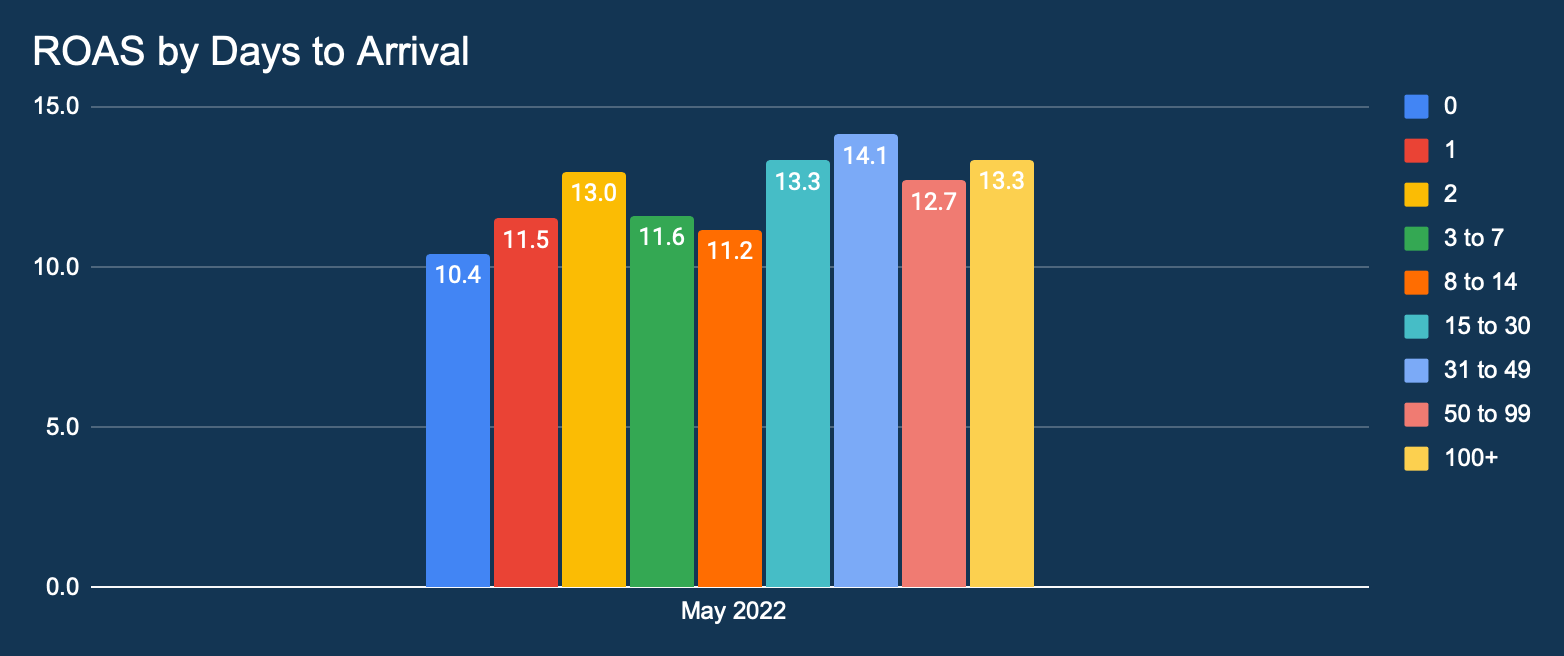
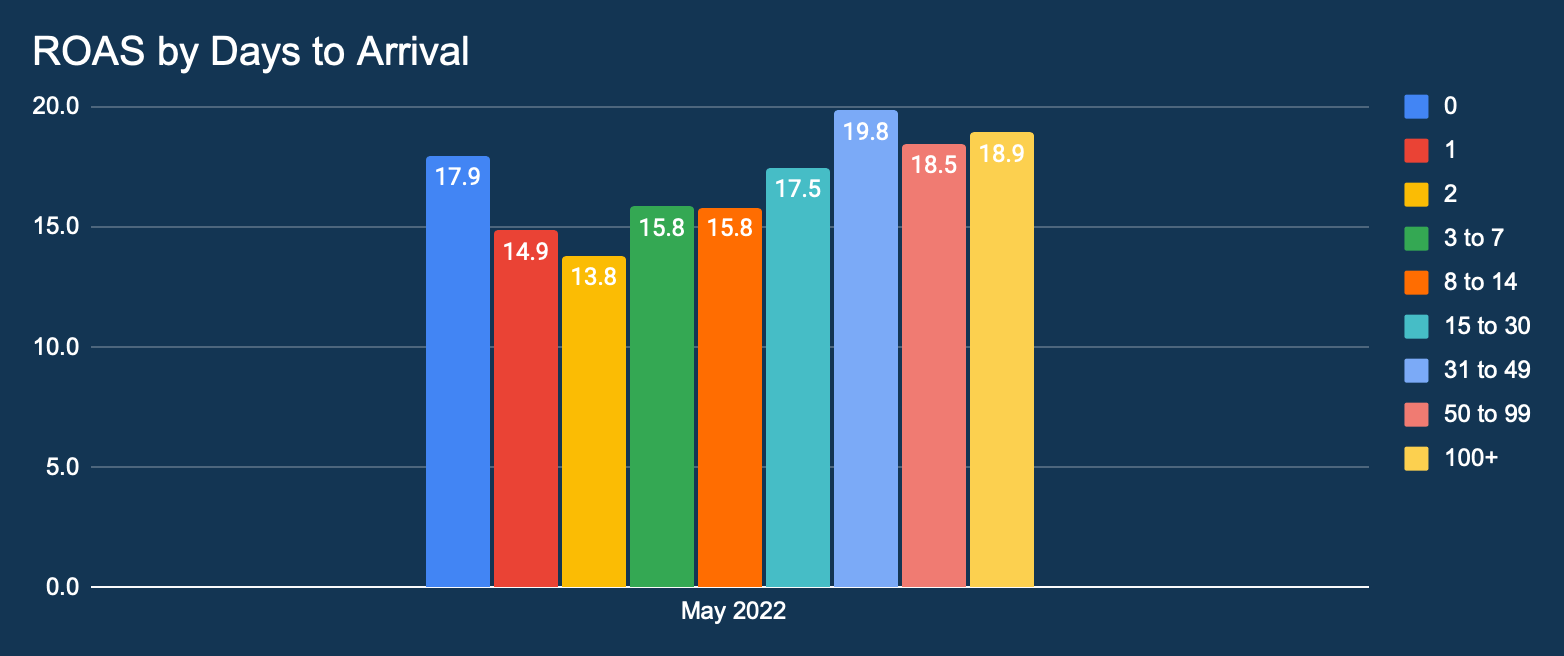
This graph shows the distribution of Return On Ad Spend (ROAS) in December 2021 by lead time.
Same day bookings and Return On Ad Spend (ROAS) saw a significant increase over April in May 2022 – 8.6 vs 10.4. Longer days to arrival sees the most significant increase in Return On Ad Spend and related to summer travel bookings.
APAC
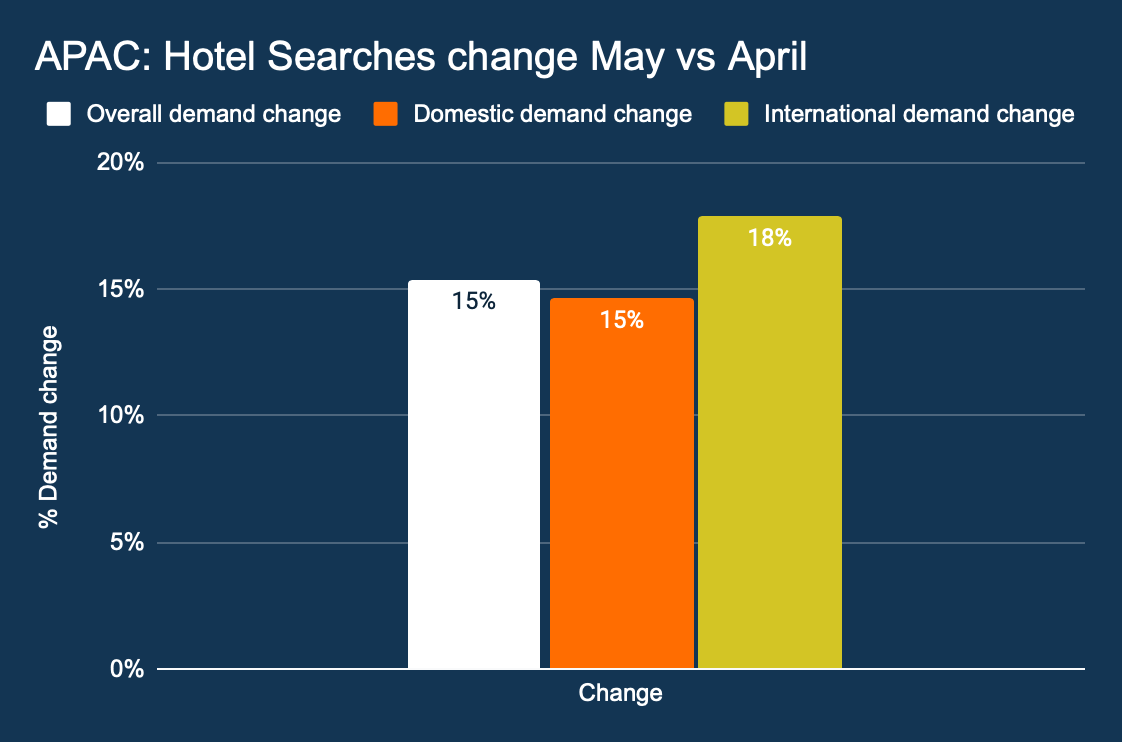
This graph shows the growth in overall hotel searches month on month, as well as the change in domestic and international hotel searches.
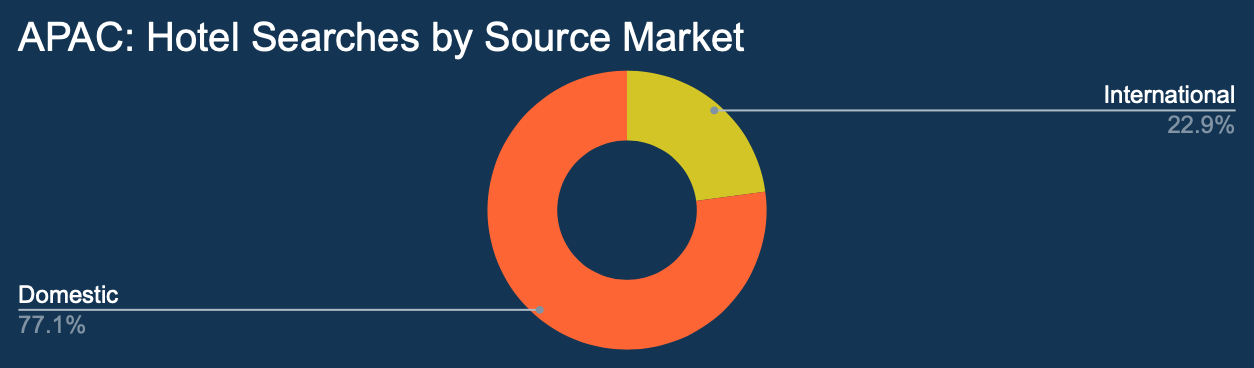
This graph shows all hotel searches by origin.
May saw a boom in hotel searches in APAC. International searches increased from 19.9% in April to 22.9% in May 2022. All indications are that APAC travel is returning to some normalcy.
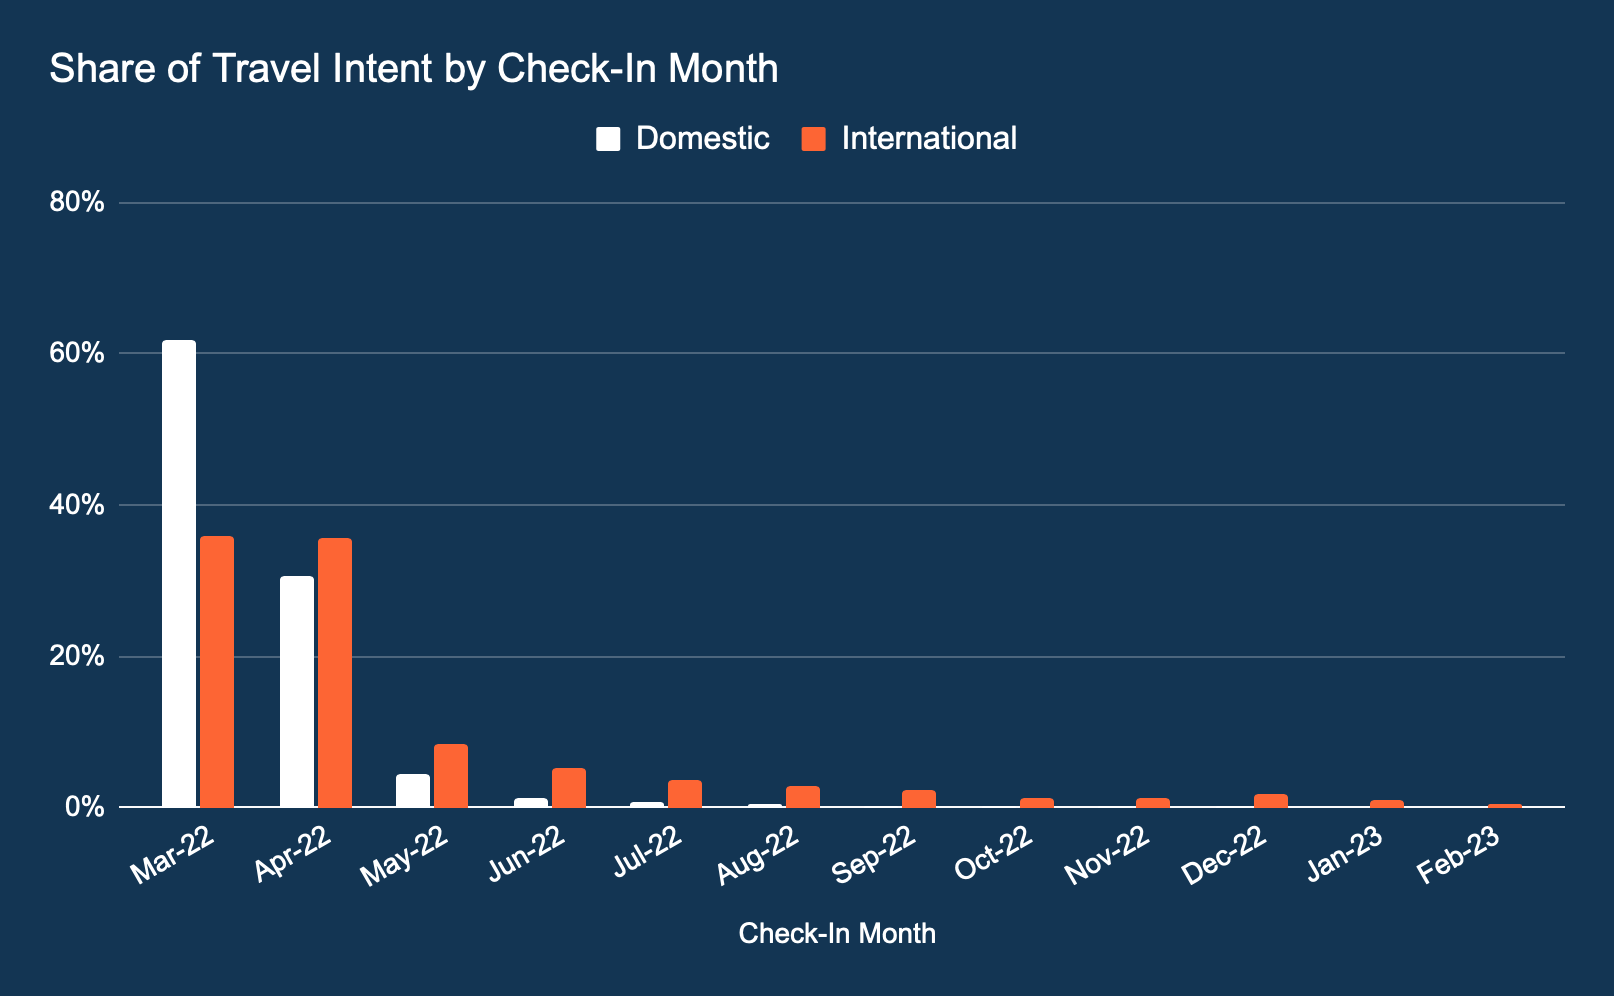
This graph shows the distribution of searched travel dates. The percentage indicates the proportioned part of every searched check-in month in comparison to the total hotel searches.
In trends similar to those seen in the Americans and EMEA, travel intent is keenest on check-ins between 0-60 days in advance. Improving travel confidence is evident but remains intra-regional relevant.
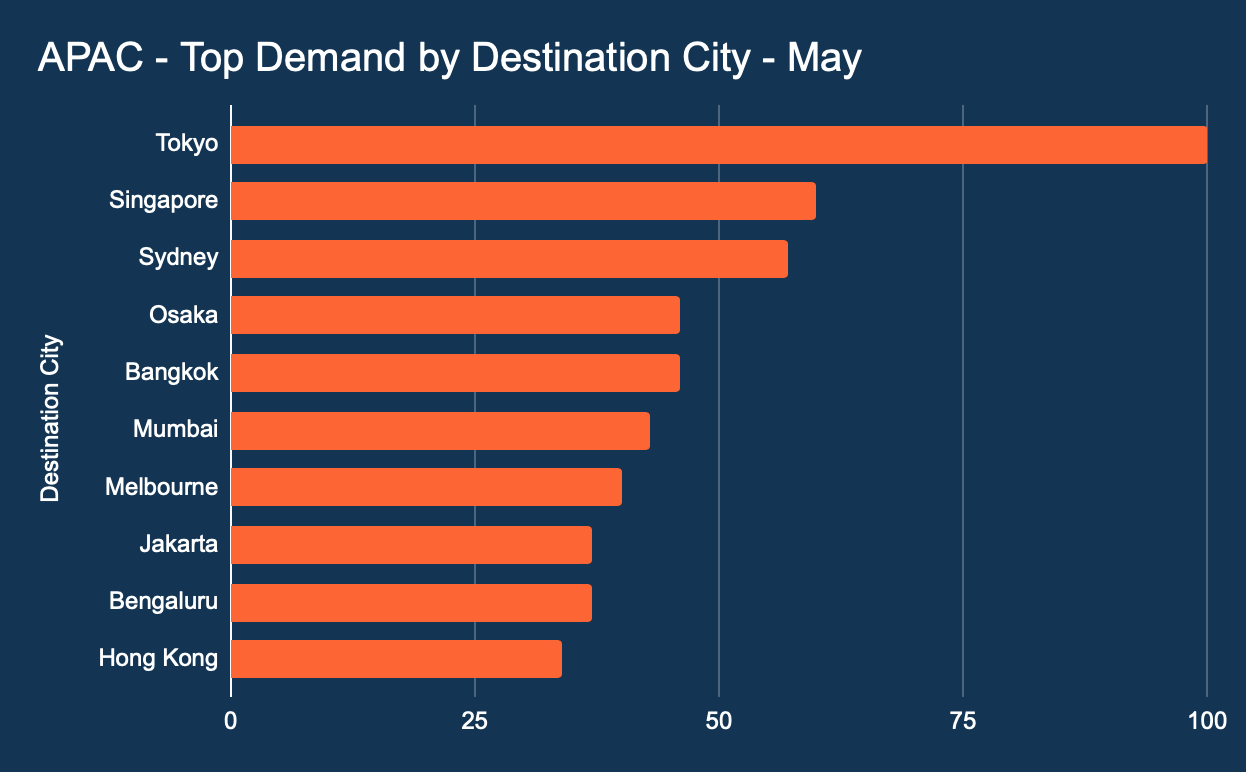
This graph shows demand by destination or city.
Tokyo occupies the top spot. Bangkok continues to improve. Sydney and Melbourne continuous presence indicate good signs for Australian travel recovery.
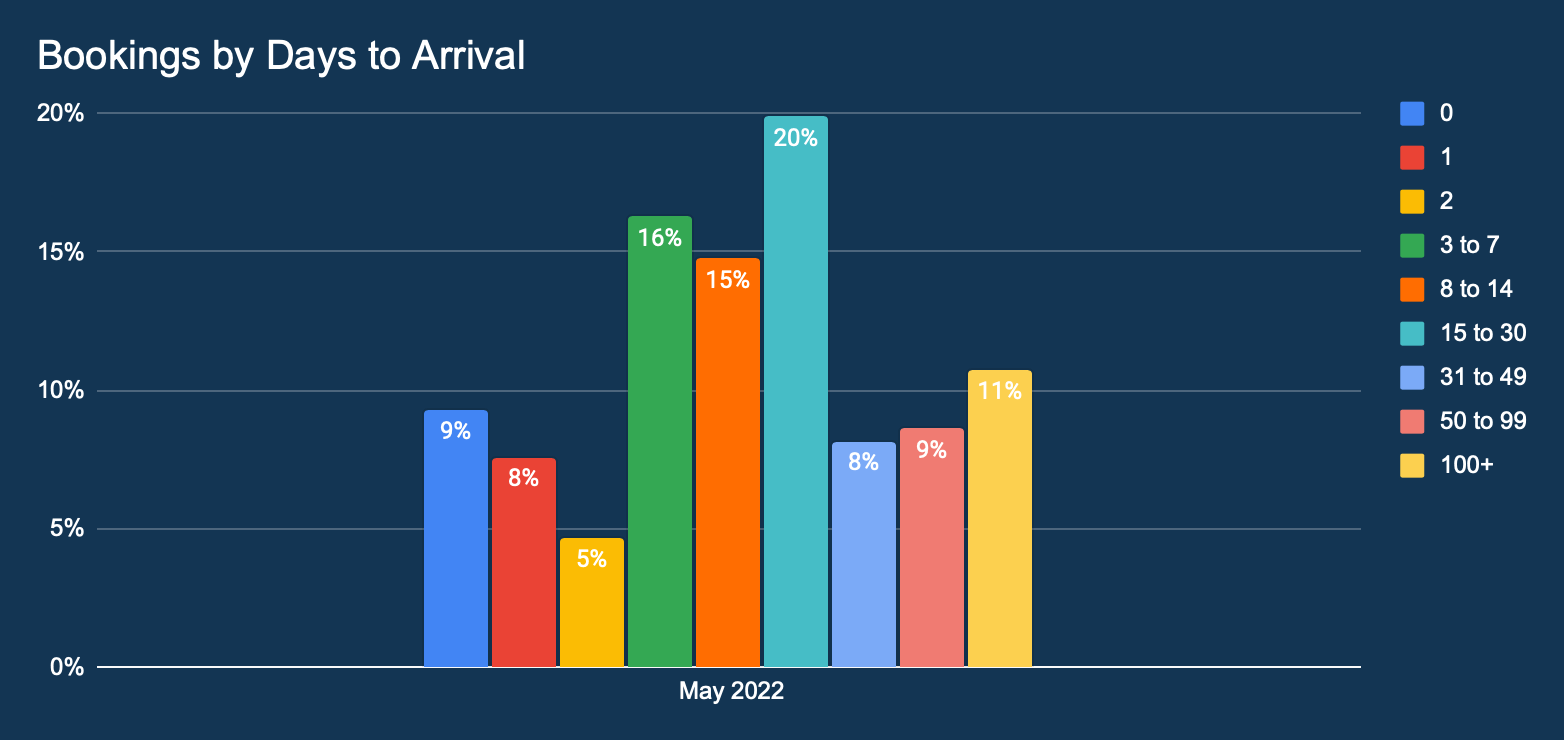
This graph shows the lead time distribution of all hotel bookings made in December 2021. The percentage indicates the proportion of bookings in comparison to the total number of hotel bookings.
Data on Bookings by Days to Arrival for APAC is quite sporadic. Bookings with 0-60 days to arrival remain the most common bookings: over 73%. This suggests that, although spontaneous and short-term travel plans are common within the APAC region, planning is gradually improving.
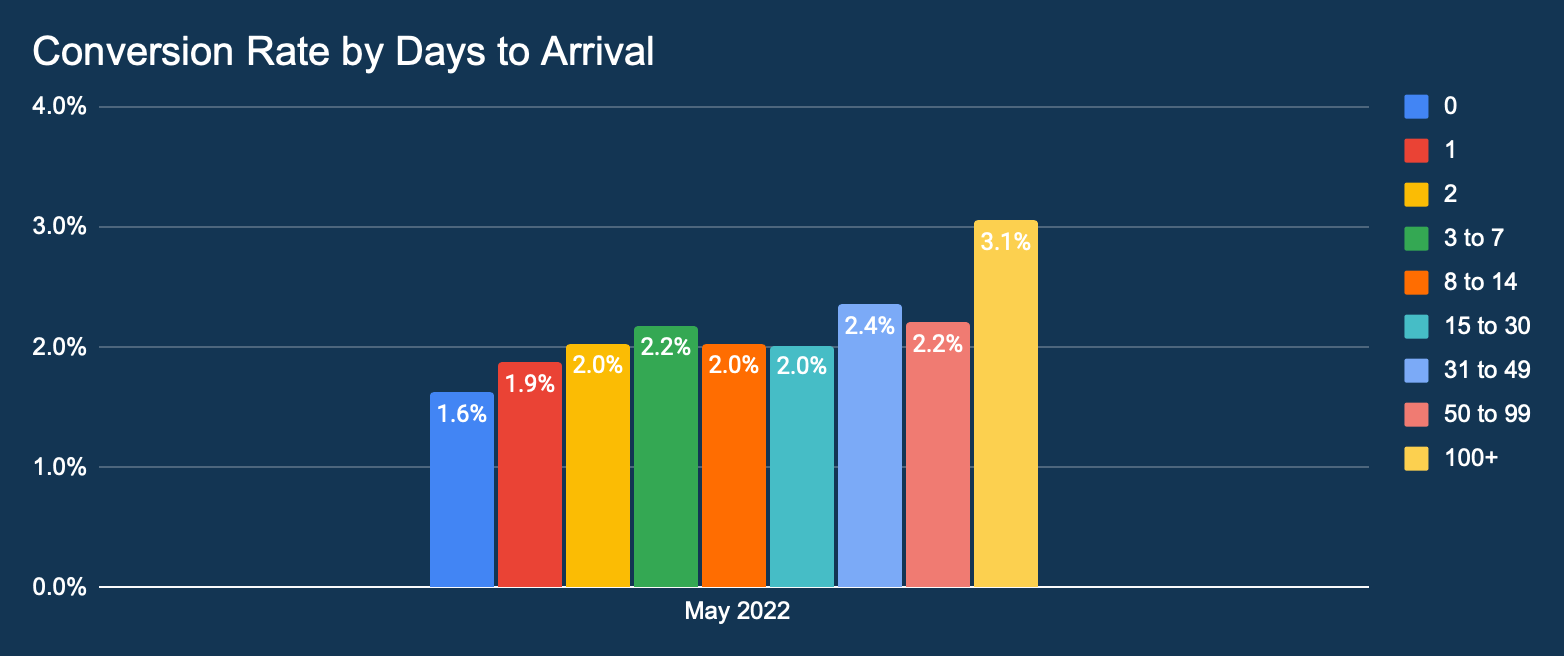
This graph shows the percentage distribution of conversion rates by lead time.
Average conversion rate of 2% across days to arrivals remains stable.
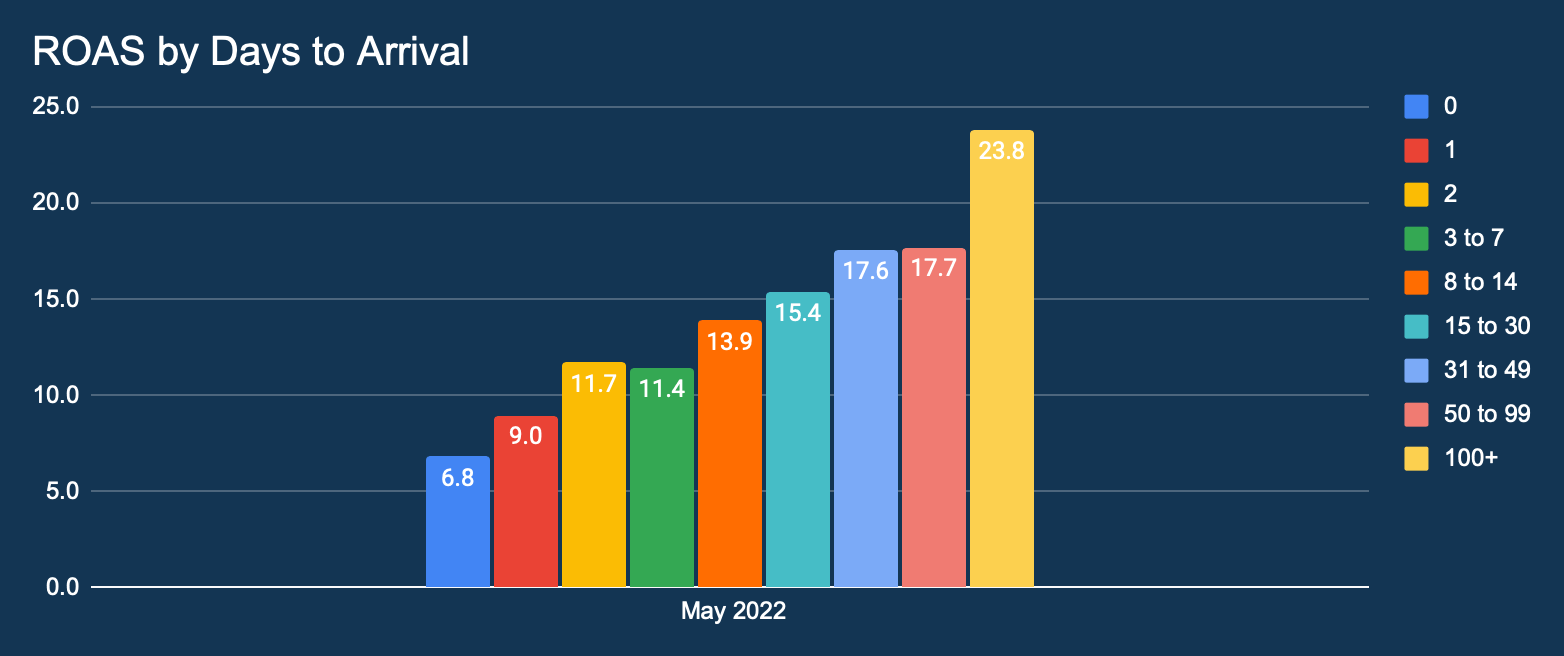
This graph shows the distribution of Return On Ad Spend (ROAS) in December 2021 by lead time.
String indication of long term travel planning is evident. 100+ days seeing the highest Return On Ad Spend which suggests long term planning is now evident. Hoteliers should invest further ahead to get a better return on their media budgets.
About Marketing Services by DerbySoft
We’ve been helping the hotel sector for many years to use data and digital to build successful businesses. Competition has never been fiercer, margins never finer and driving bookings never more complex.
Simple marketing activity is not enough. To get the most from your budget; strategies, campaigns and decisions need to be smarter and more accurate.
To achieve this we have built intelligent technologies that will optimise your budget, audience, channels and results; producing multi-channel campaigns that just work, in your hands or in ours. DerbySoft offers digital marketing hotel expertise, enhanced by intelligent technology.
Have any questions?
If you would like to see more information or need any specific insights for your hotel country or source market, contact us.